Carnegie Tier 1 federal dependency trends are different than those for doctoral institutions in other tiers
Executive Summary
Problem: Prior analyses of Carnegie Tier1 ranked institutions found federal R&D dependency declining from roughly 75% in the mid-1970s to 55% by 2024, with forecasts suggesting further erosion under sustained federal funding cuts. Taking a similar methodological approach, I expanded the dataset to include all doctoral tiers. I use “Tier” or “T” rather than the colloquially used “R” designation (e.g., R1) because the “R” designation has not been consistently used across cycles since 1970.
Approach: The analysis compares federal R&D dependency across all three Carnegie doctoral tiers (2010-2024) using the NSF HERD Survey joined to Carnegie Classification data via exact institutional-ID match. Federal share of total R&D expenditure is examined by tier, research field, institutional control (public/private), and time-varying EPSCoR eligibility status, testing whether the funding patterns documented for Tier1 institutions generalize to the broader doctoral population.
Insights: Tier1’s share of the total doctoral federal R&D pool has grown steadily while Tier2’s has fallen and Tier3’s has stayed negligible – the aggregate federal dependency picture is increasingly a Tier1 story. Field-level federal dependency follows a similar hierarchy across tiers, but Tier3 diverges in fields like “Other sciences” and “Non-S&E.” Public and private institutions show a consistent inverse relationship between federal and state funding share. EPSCoR status changes direction by tier: EPSCoR institutions are less federally dependent than Non-EPSCoR in Tier1 throughout the period, but the pattern reverses in Tier2 and Tier3 by the early 2020s. Institution-level growth variance substantially exceeds state-level variance for both EPSCoR groups, meaning state-level summaries mask real differences between institutions.
Significance: Tier1-only analyses obscure meaningful heterogeneity in how federal dependency plays out across the doctoral population. Institutions and policymakers assessing exposure to federal funding shifts need a tier- and EPSCoR-specific picture. The results are limited by a data-quality constraint – unresolved institutional-ID inconsistencies in the Carnegie-HERD join – that must be addressed before institutional movement between tiers can be reliably studied.
Key Findings
- Tier1 captures a growing share of the total doctoral federal R&D pool (roughly 85% to 92% of the total, 2010-2024) while Tier2’s share fell from about 13% to 8% and Tier3 has remained under 1% throughout.
- Federal dependency by field follows a similar hierarchy across tiers – computer/information sciences and physical sciences are most federally dependent, Non-S&E fields least – but Tier3 shows a distinctly compressed pattern in “Other sciences” and “Non-S&E.”
- Public institutions rely more on state funding (about 8-9% of total R&D) and less on federal funding (about 53-57%) than private institutions (about 3-4% state, 57-70% federal).
- EPSCoR Tier1 institutions are less federally dependent than Non-EPSCoR institutions across the full 2010-2024 period.
- EPSCoR Tier2 and Tier3 institutions become more federally dependent by 2021-2024.
- Institution-level HERD growth variance (2010-2024) is far larger than state-level variance for both EPSCoR groups, and Non-EPSCoR institutions show a longer tail of high-growth outliers than EPSCoR institutions.
Research Question
Do all doctoral institutions follow the pattern of Tier1 federal funding dependency?
Research Answers
Data range: Data are limited to a start date of 2010, when IPEDS values were first available for HERD, allowing direct one-to-one matching with Carnegie Classification data.
Federal Dependency by Tier
Figure 1 shows federal share of total R&D expenditure for each tier alongside the all-doctoral average, 2010-2024. Tier1 tracks closely with the all-doctoral average throughout the period, since it dominates the pool. Tier2 sits consistently below Tier1, and Tier3 shows the most volatility – including a marked compression around 2018 – but remains a small share of the total picture on its own. The federal dependency numbers describe funding share, not the underlying dollar pool.
Figure 1. Federal Share of R&D Expenditures by Carnegie Doctoral Tier, 2010-2024.
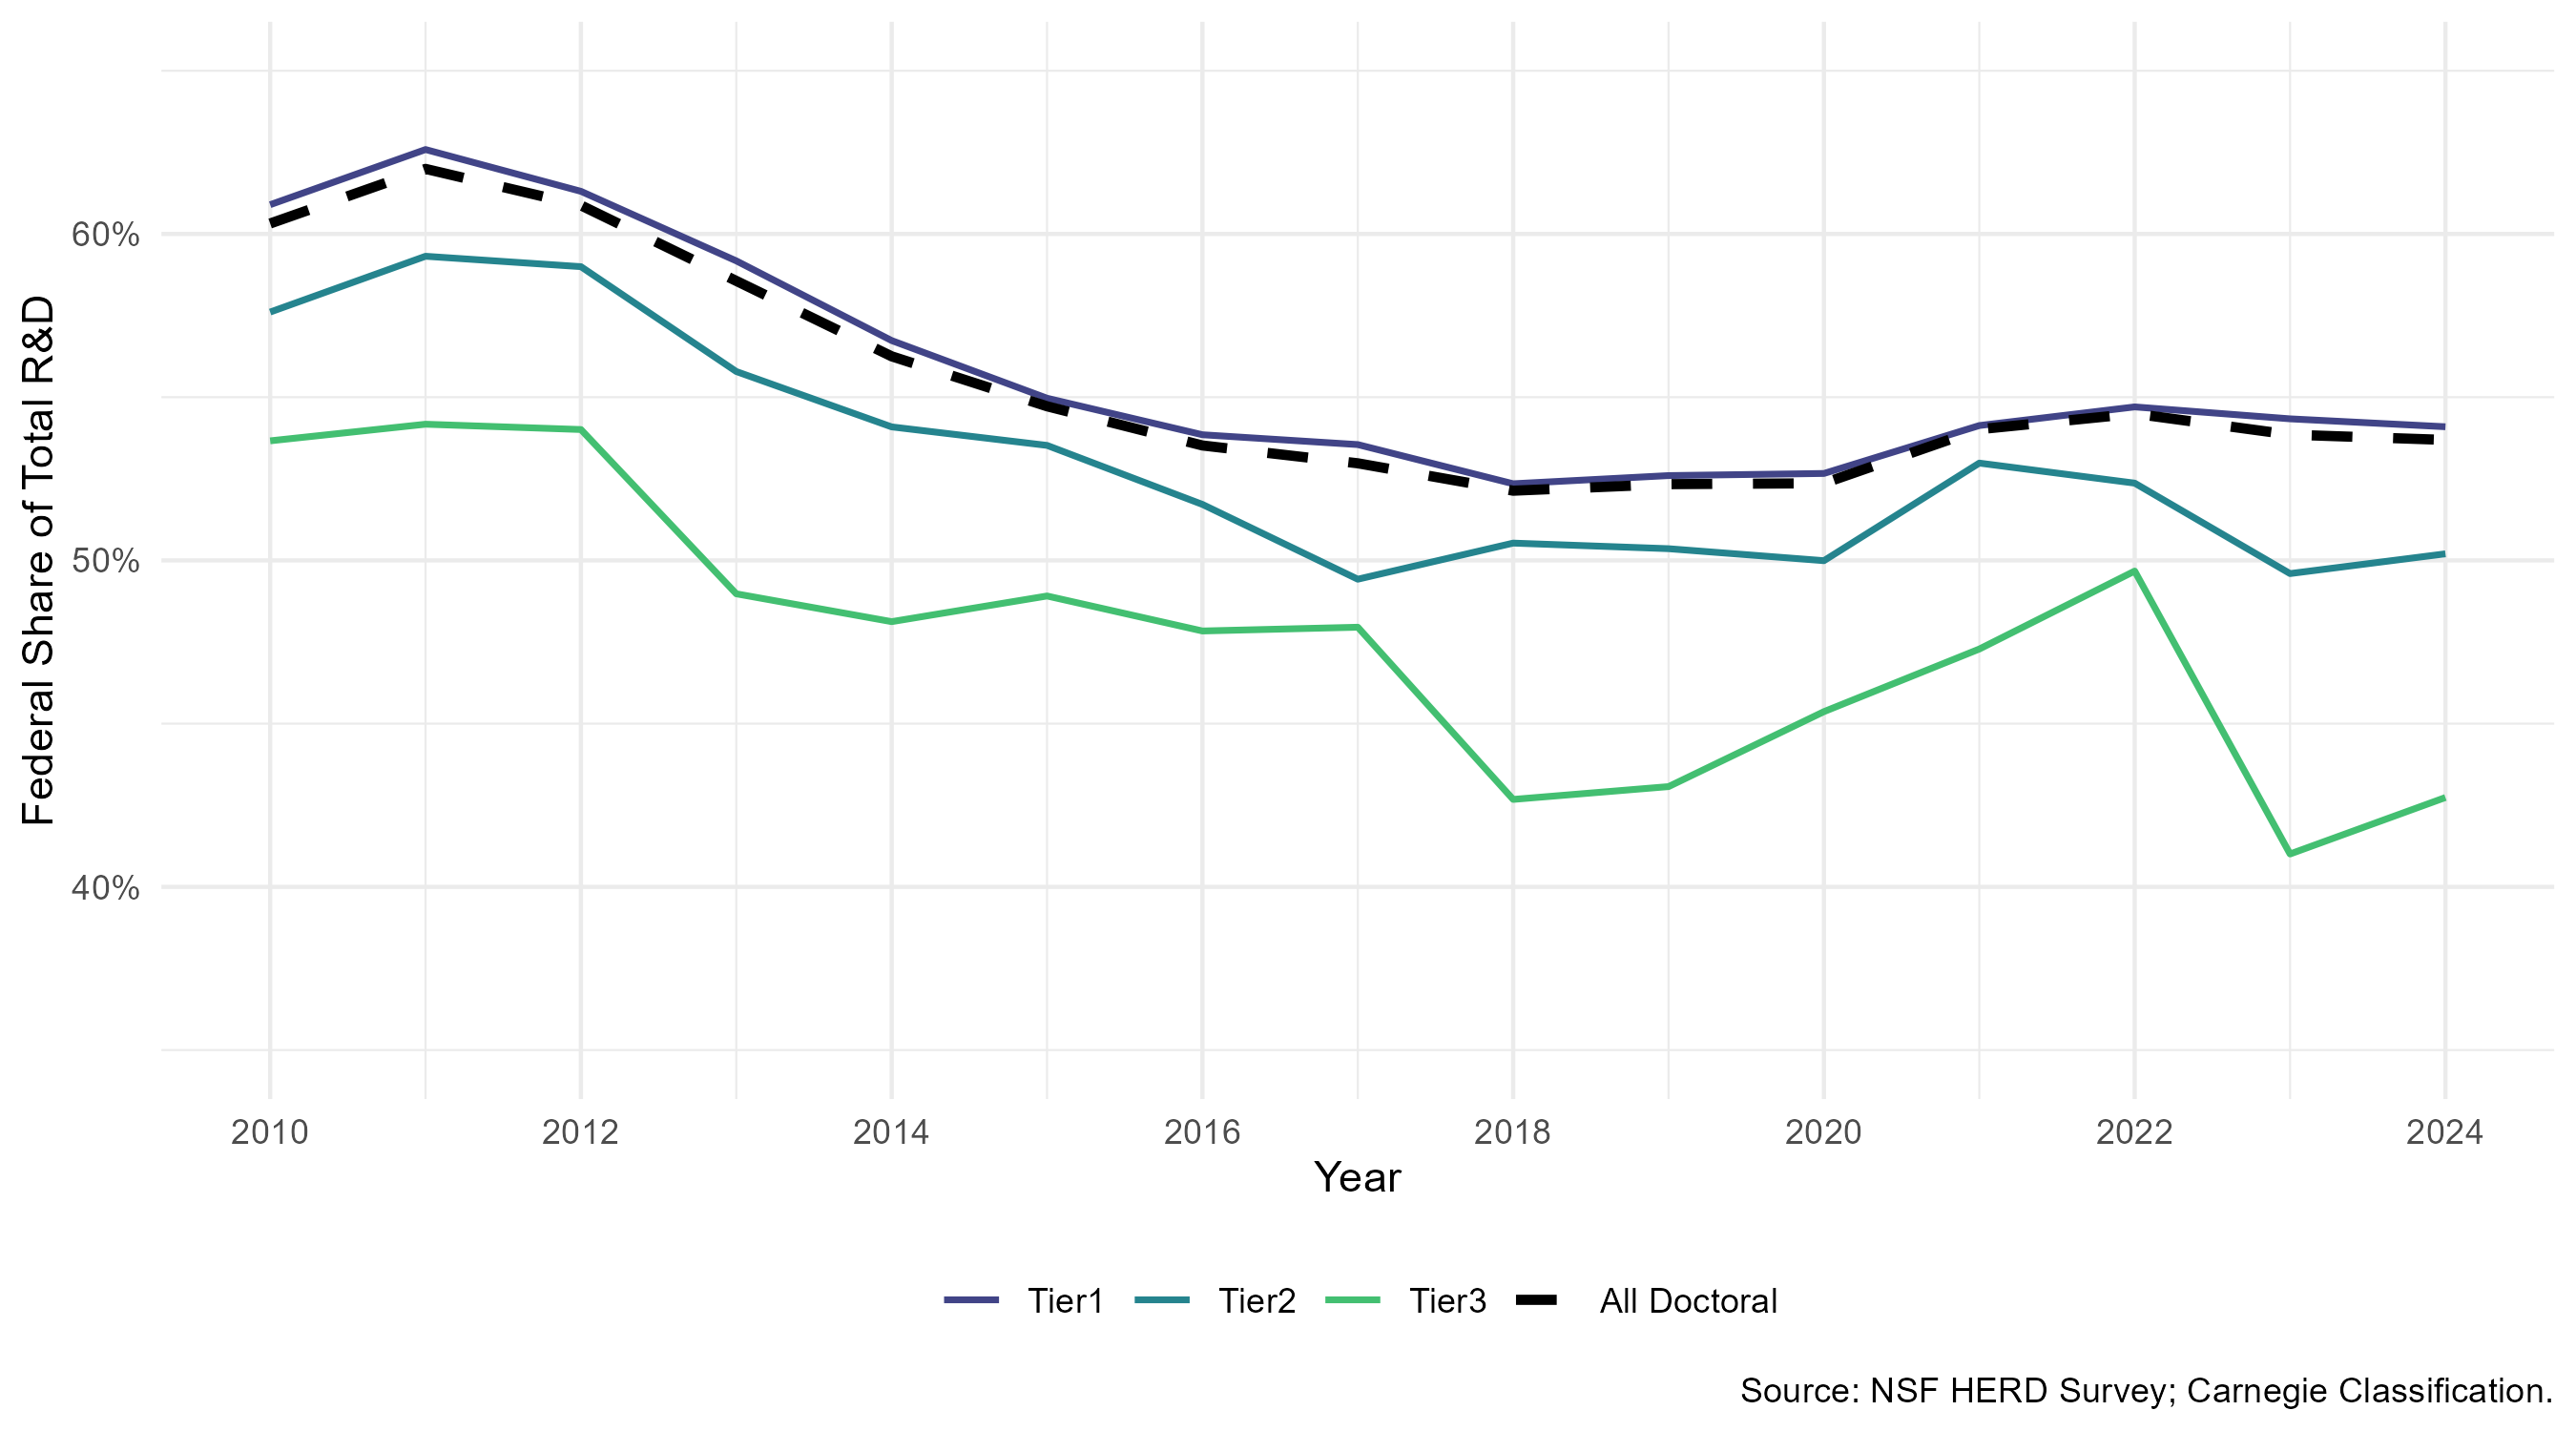
Interpretation: Tier1 anchors the all-doctoral average, while Tier2 and Tier3 diverge from it in different directions and at different points in the period.
Figure 2 and Figure 3 break out each tier’s share of the total doctoral federal R&D pool – a different, and in some ways more consequential, measure of concentration. Tier1’s share of the total doctoral federal R&D pool rose from roughly 85% in 2010 to over 92% by 2021, before easing slightly to around 91% by 2024. Tier2’s share fell steadily over the same period, from about 13% to roughly 8%, with a sharp step down around 2018. Tier3’s share never exceeds 1% of the pool and follows the same 2018 compression pattern, though at a much smaller scale.
Figure 2. Share of Doctoral Federal R&D Pool by Carnegie Tier, 2010-2024.
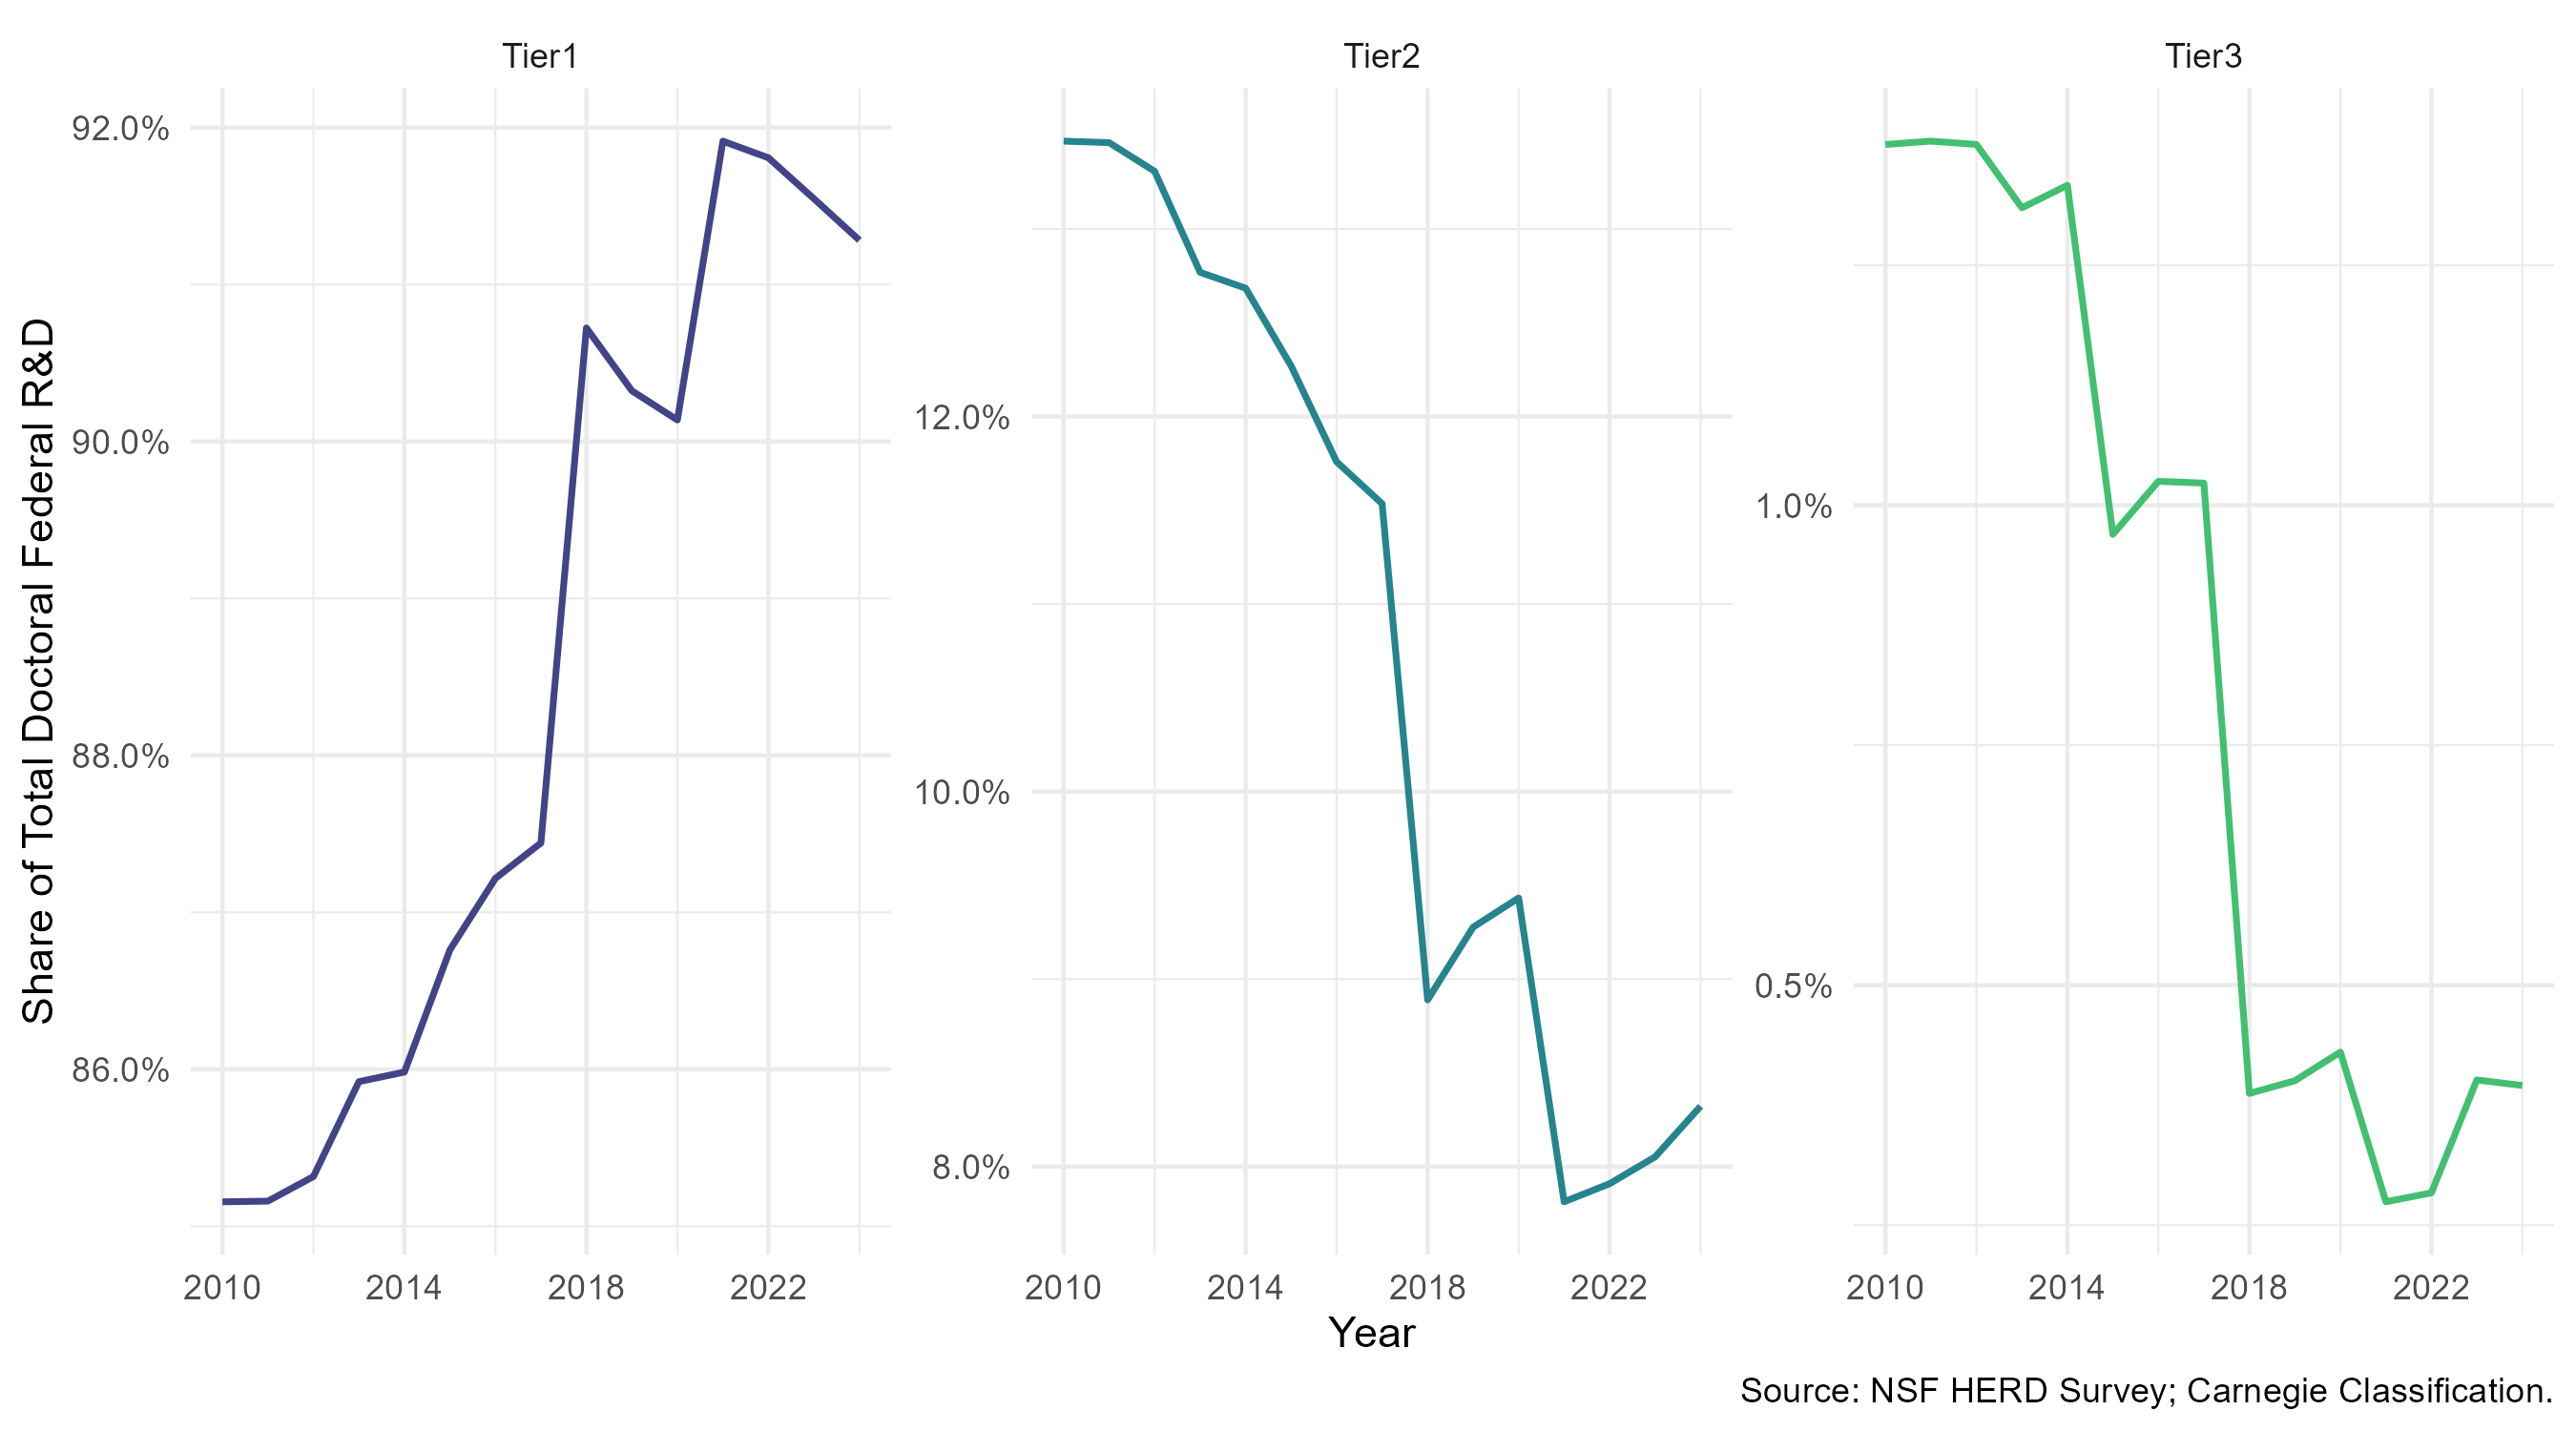
Interpretation: The faceted view shows Tier1’s climbing pool share and Tier2’s decline as near mirror images of each other.
Removing Tier1 (Figure 3) makes the Tier2-versus-Tier3 divergence clearer: Tier2 declines from roughly 13% to 8% of the doctoral pool, while Tier3 declines more modestly from about 1.5% to under 0.5%. The federal doctoral funding pool is increasingly a Tier1 story, with Tier2 losing ground and Tier3 essentially a rounding error at this level of aggregation.
Figure 3. Share of Doctoral Federal R&D Pool: Tier2 and Tier3, 2010-2024.
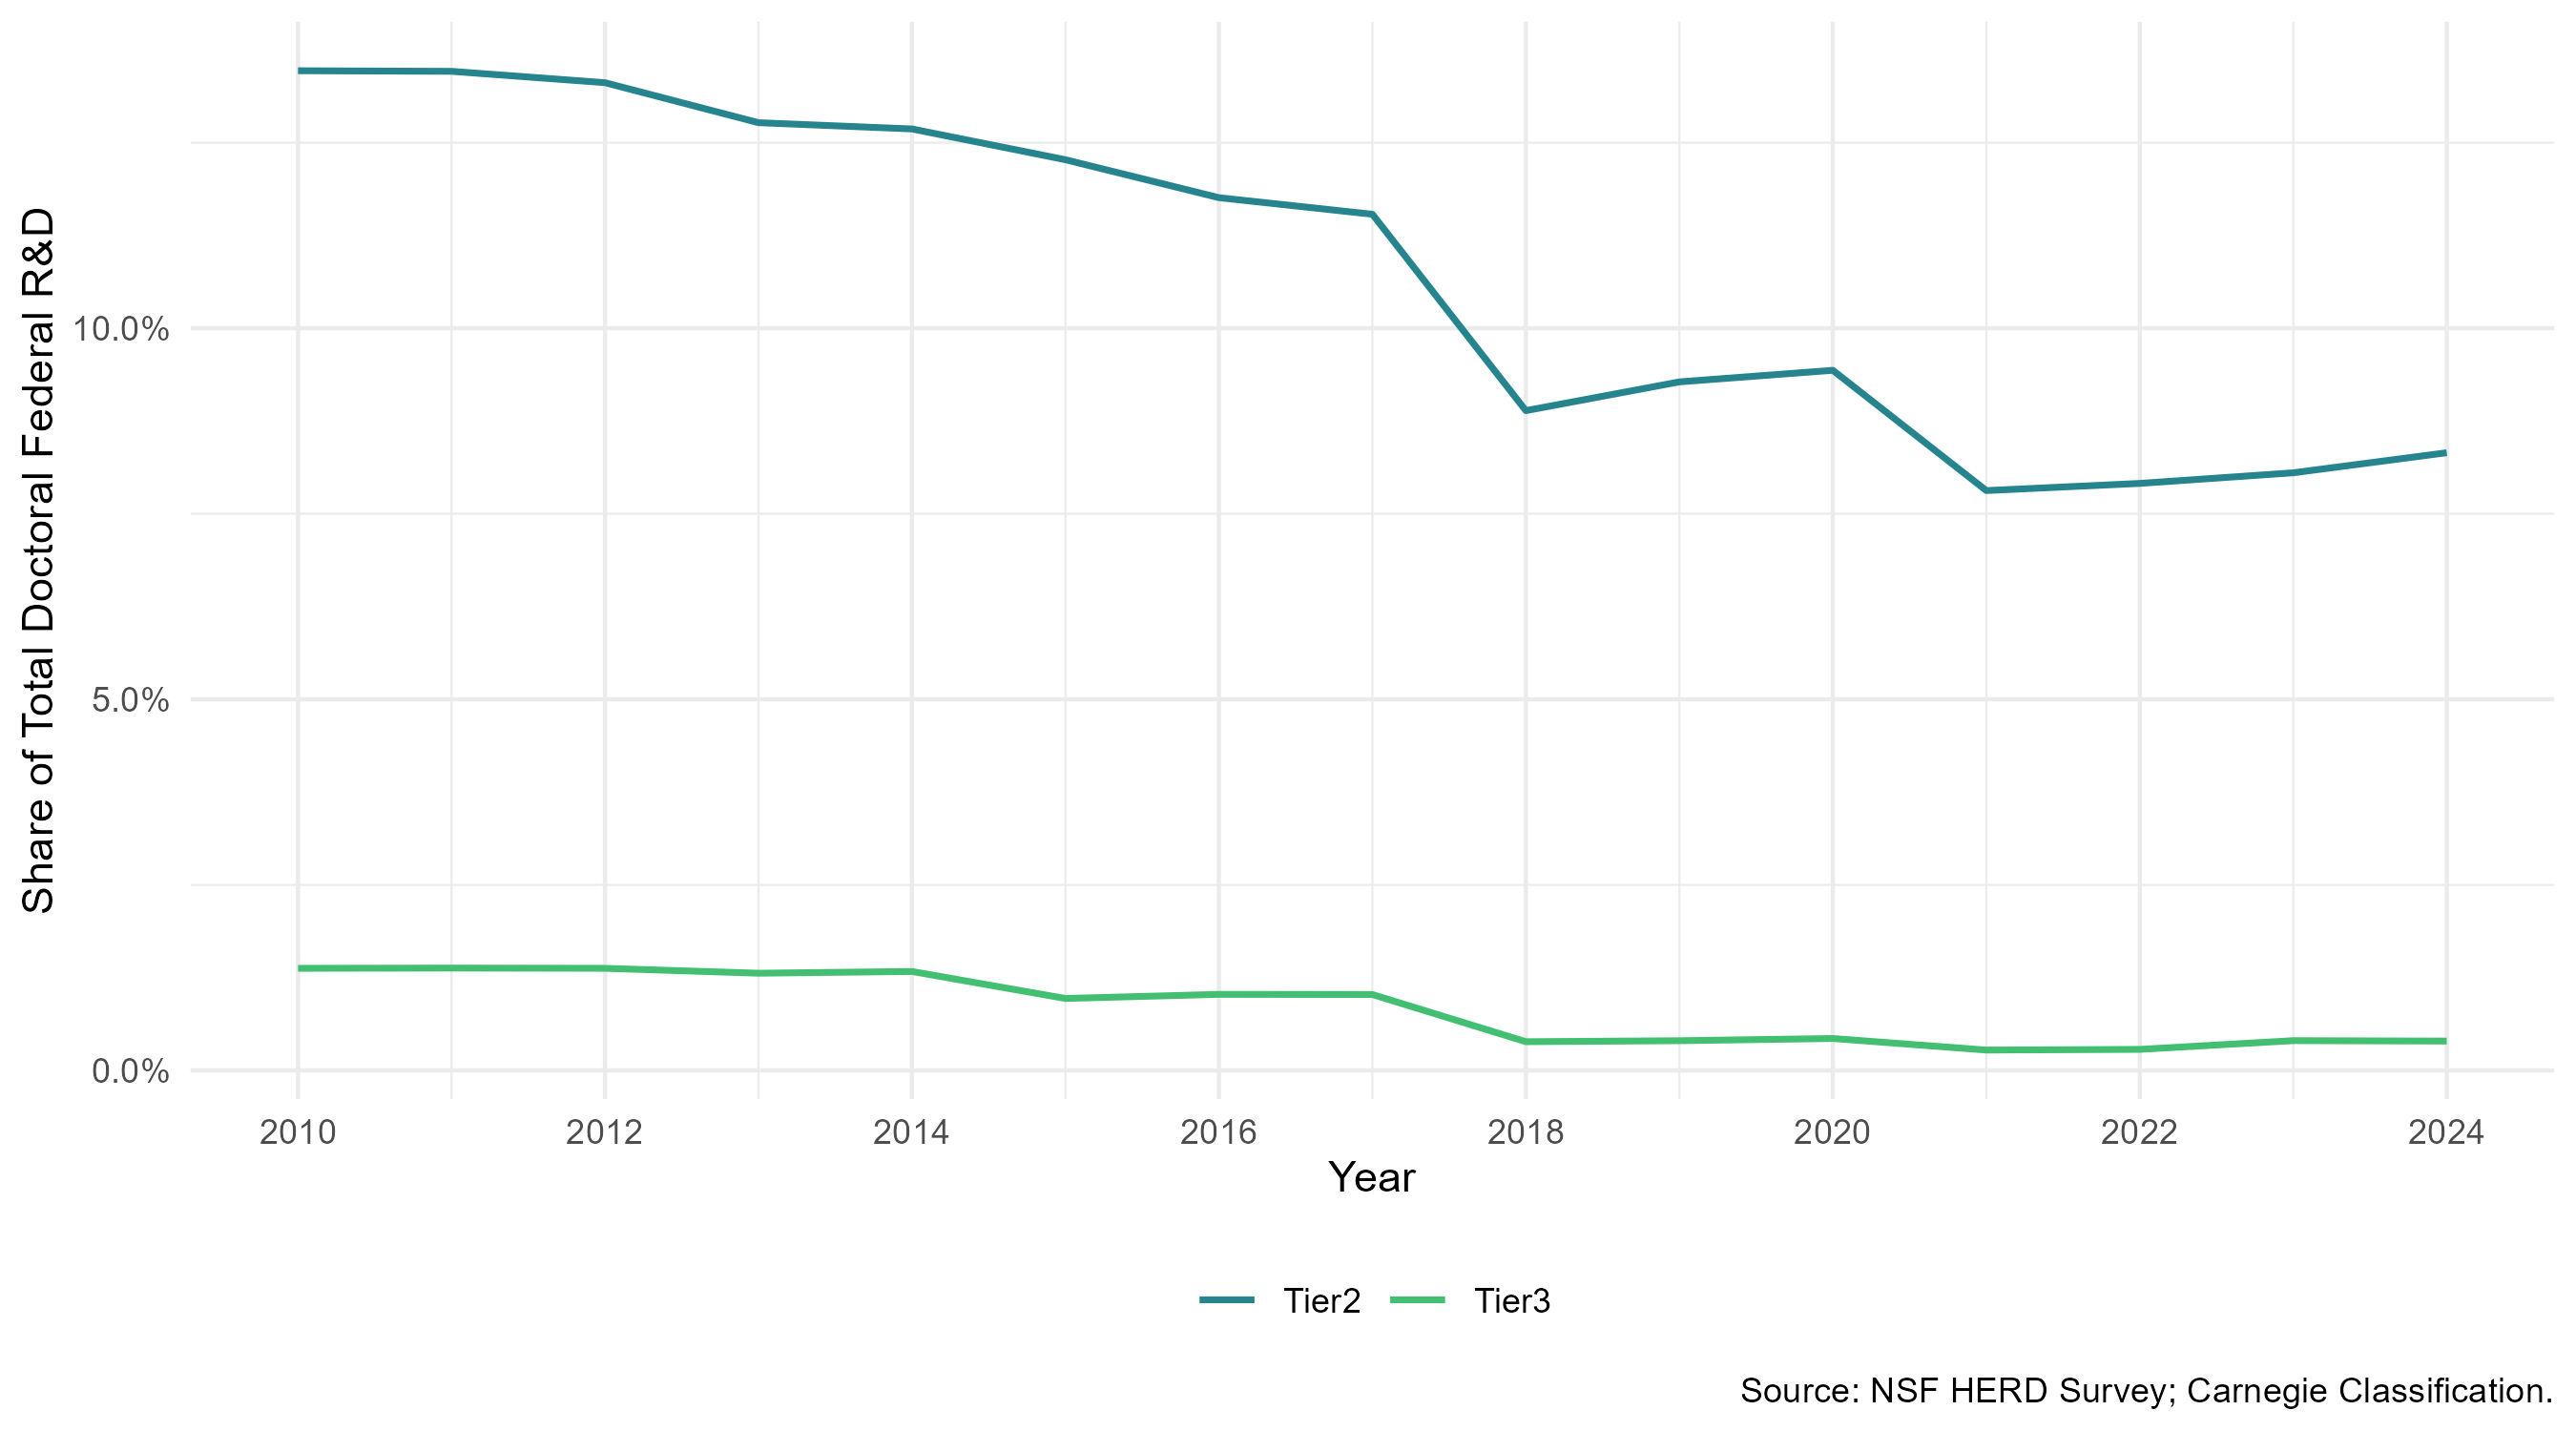
Interpretation: With Tier1 removed, the chart isolates how much ground Tier2 has lost relative to Tier3 over the same window.
Fields by Tier
Figure 4 compares mean federal share of R&D expenditure by field and tier, averaged across 2010-2024. The field hierarchy is broadly consistent across tiers: computer and information sciences, physical sciences, and geosciences are the most federally dependent fields at every tier, while Non-S&E fields (humanities, arts, education, business, law) are consistently the least dependent. Tier3 stands out in two fields – “Other sciences” (agricultural, environmental, and other applied fields) sits notably lower for Tier3 (about 20%) than for Tier1 or Tier2 (35-40%), while Tier3’s mathematics and statistics federal share (60%) is closer to Tier1’s than to Tier2’s. The full field-by-tier values underlying this figure are provided in the Appendix (Table 3) for reference.
Figure 4. Mean Federal Share of R&D by Field and Tier, 2010-2024 Average.
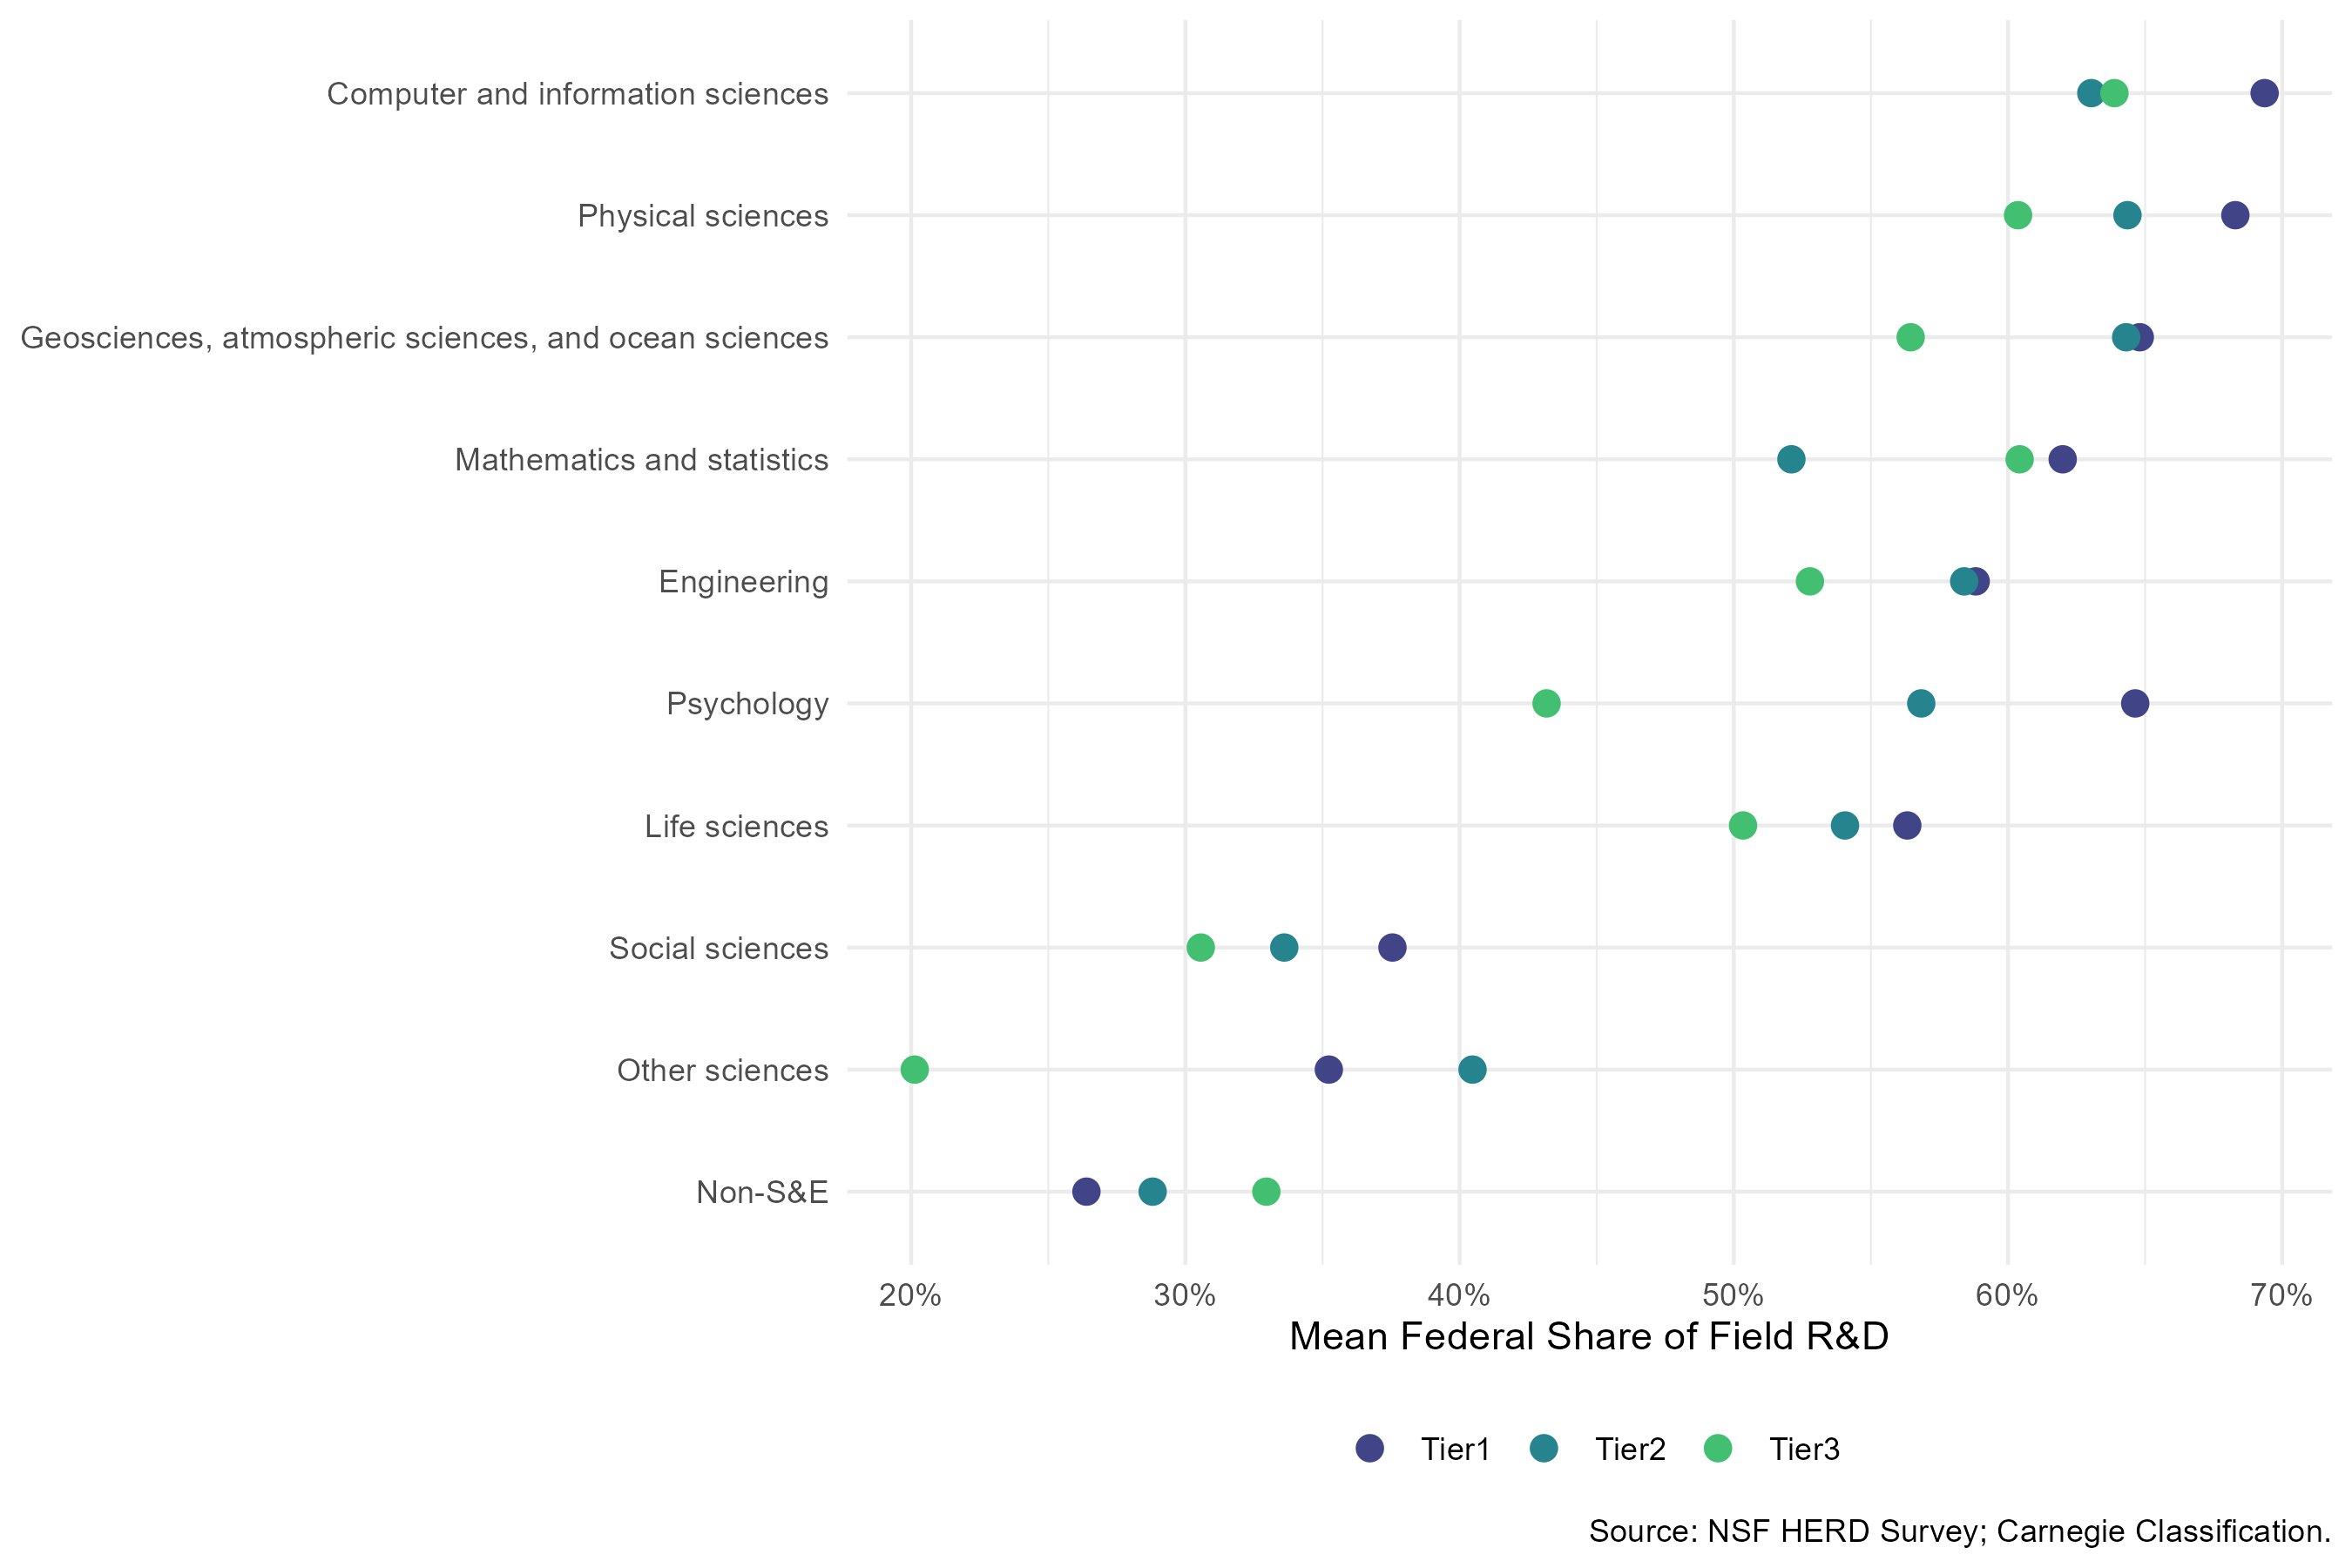
Interpretation: The consistent field ranking across tiers suggests federal funding priorities are field-driven more than tier-driven, making Tier3’s two exceptions notable.
Institutional Control
Figure 5 and Figure 6 examine how federal and state funding share differ by institutional control (public versus private) and by the intersection of control and tier. In *Figure 5**, Private institutions carry a substantially higher federal share than public institutions throughout the period (roughly 70% falling to 57%, versus about 57% falling to 53% for public institutions), while relying on far less state funding (a flat 3-4% versus 8-9% for public institutions).
Figure 5. Federal and State Share of R&D by Institutional Control, 2010-2024.
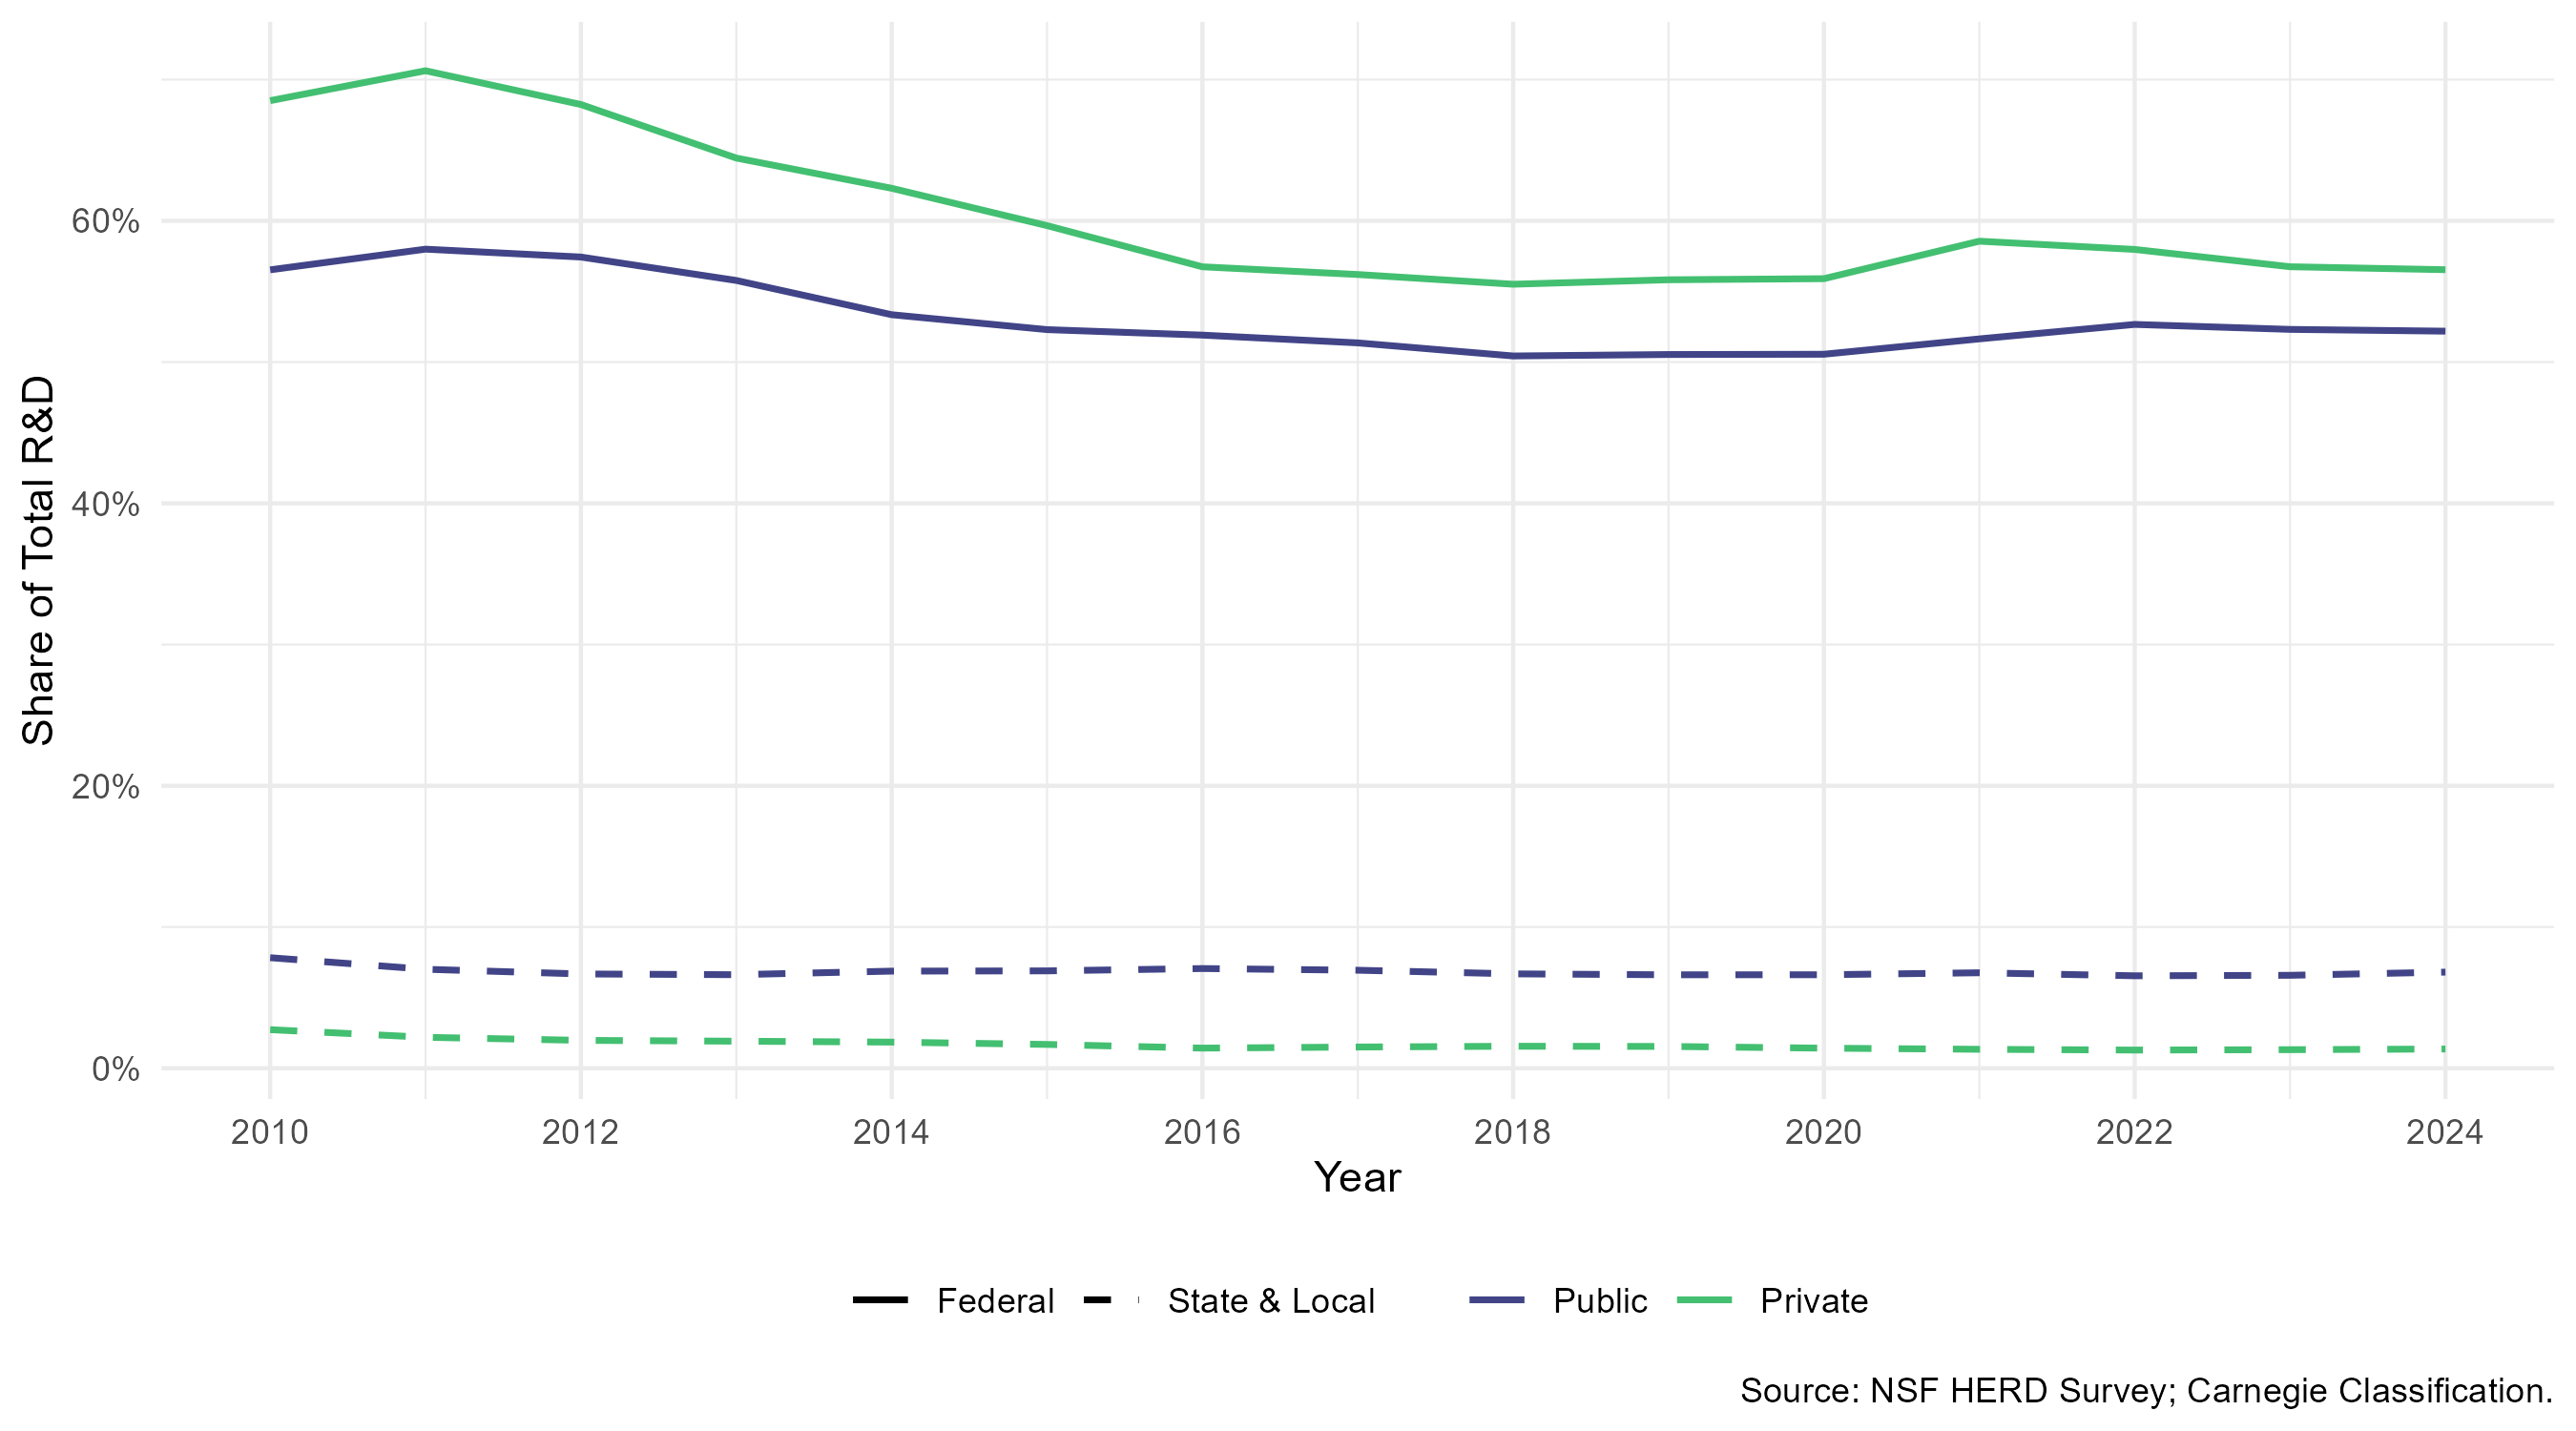
Interpretation: The federal-share gap between public and private institutions narrows over the period, while the state-funding gap stays essentially flat.
Figure 6 shows this pattern holds within tier: public institutions in every tier draw more state funding than their private counterparts, with Tier3 public institutions showing the most volatile state share of any group, spiking above 14% around 2023 after a 2018 compression similar to the pool-share pattern in Figure 2.
Figure 6. State & Local Share of R&D by Tier and Control, 2010-2024.
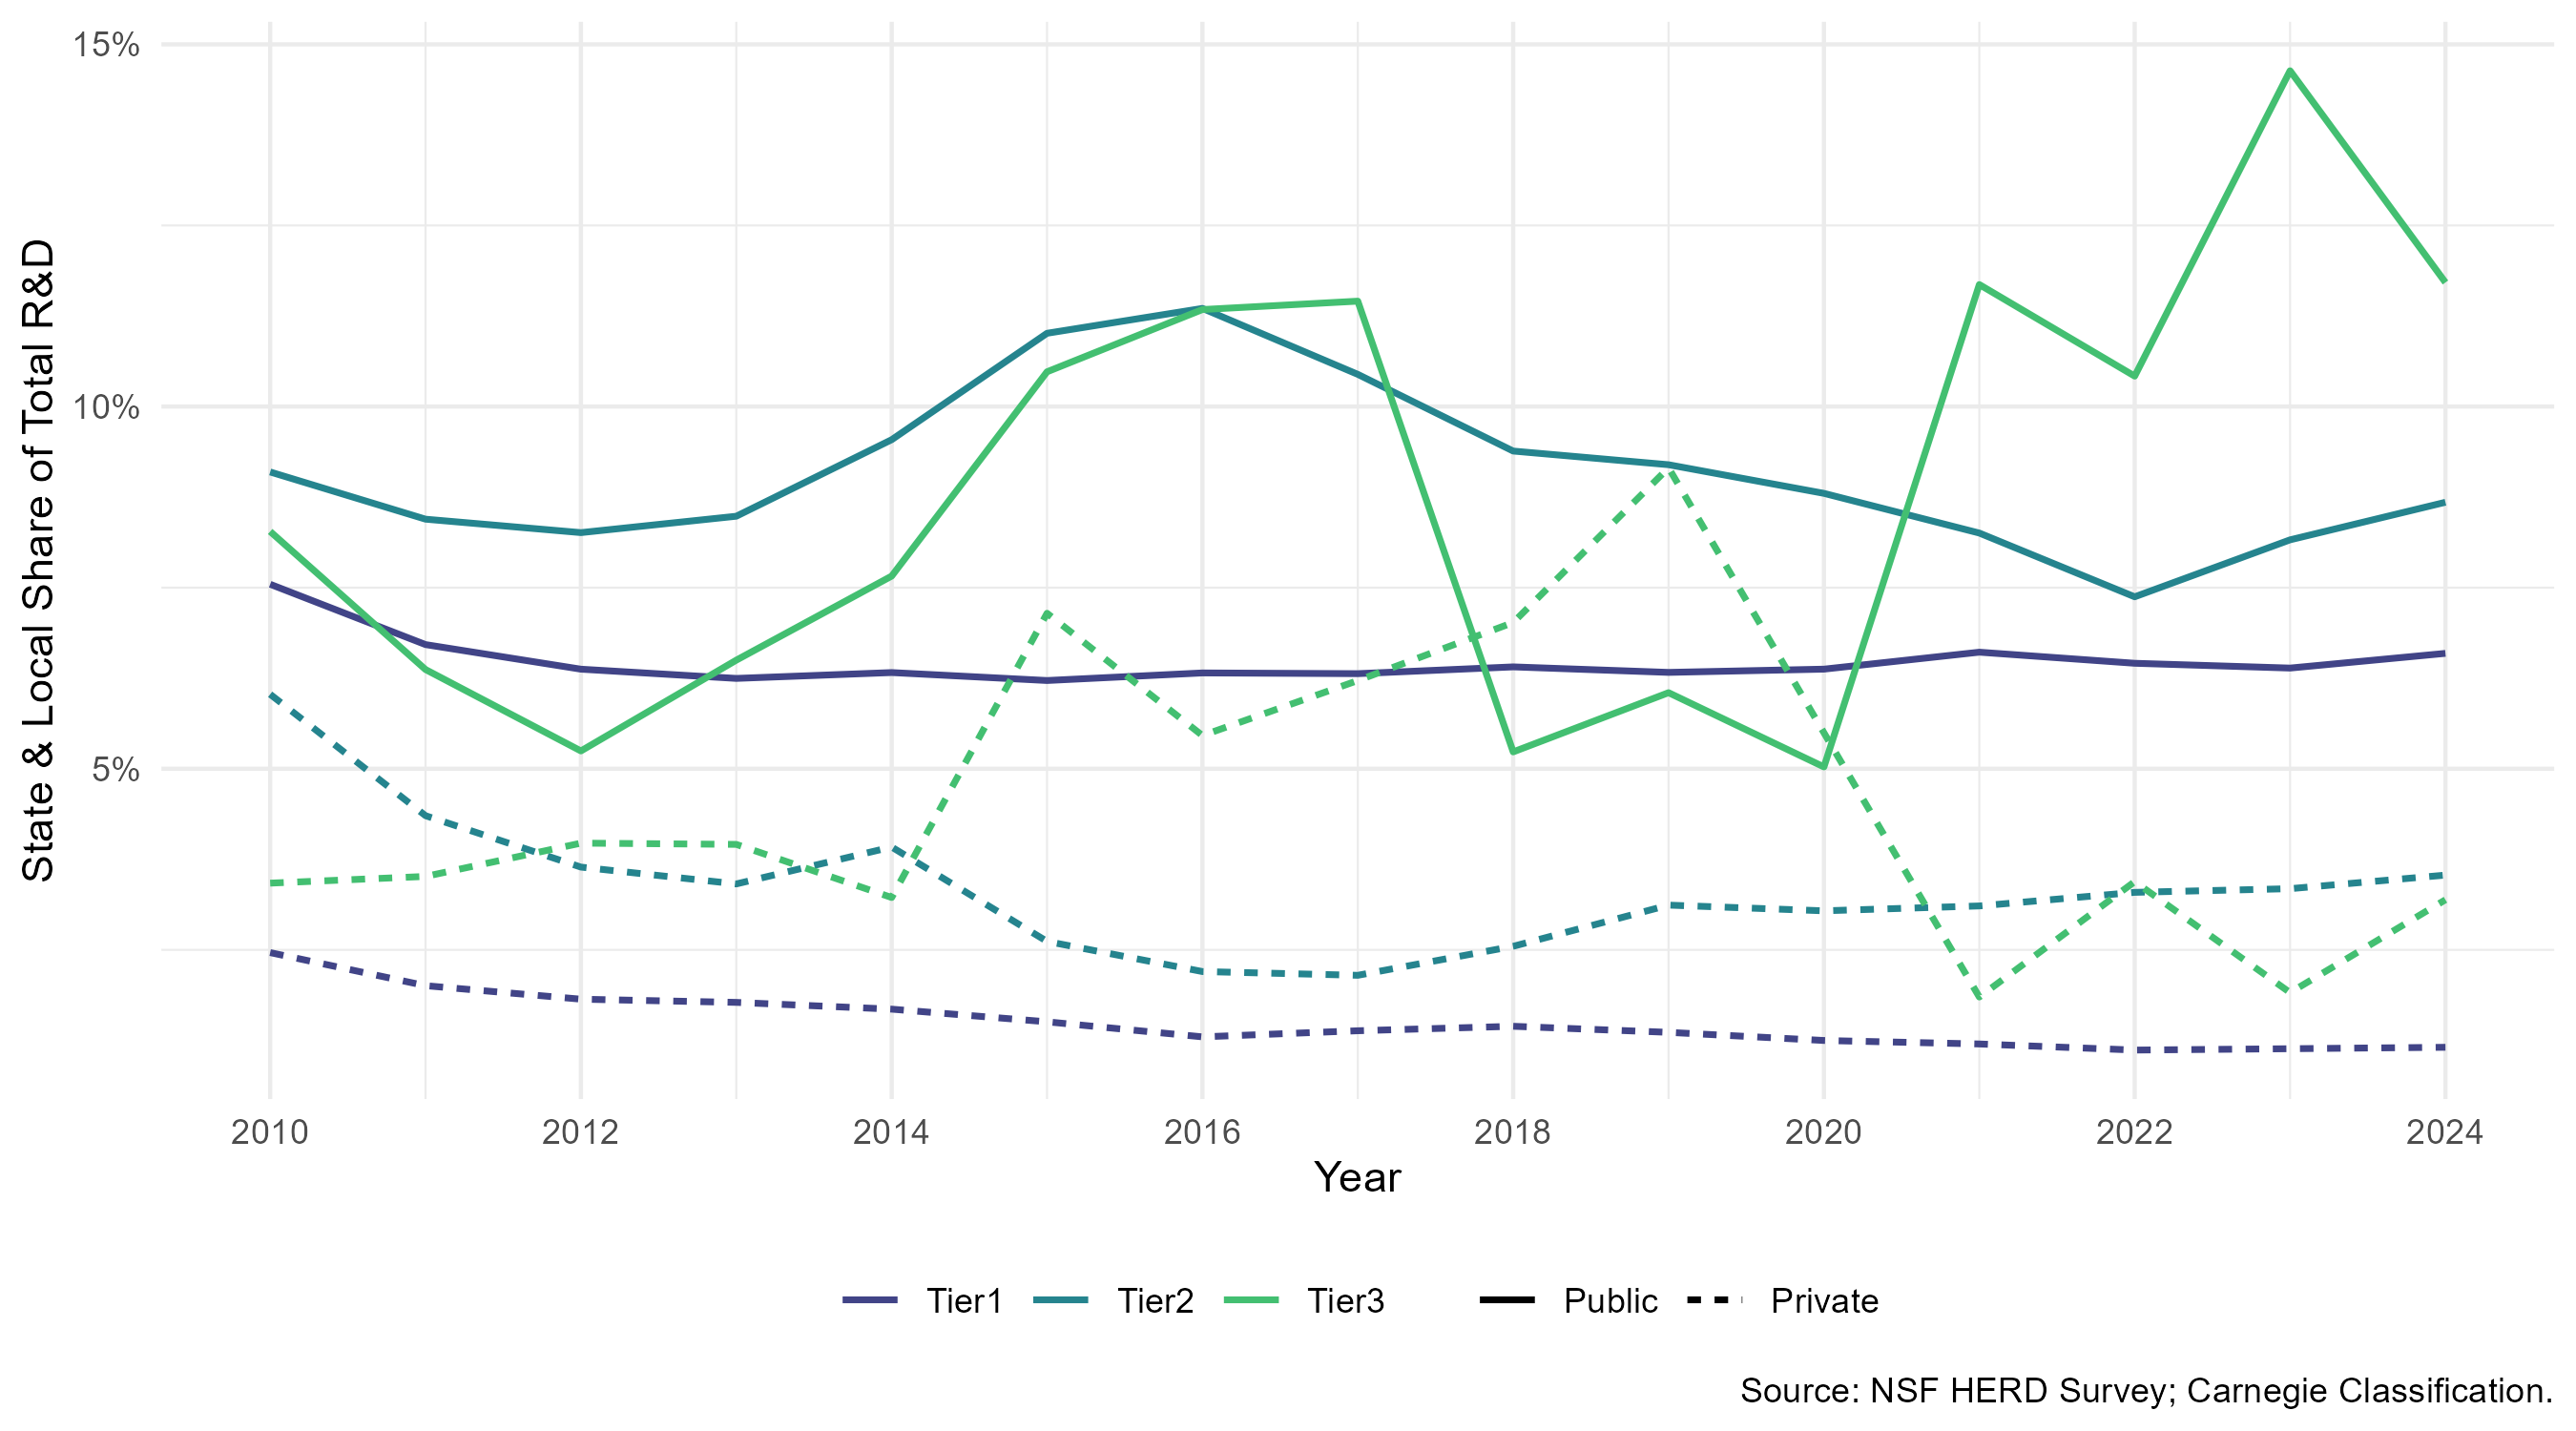
Interpretation: Tier3 public institutions’ 2023 spike is the most extreme state-funding swing of any tier-control group in the dataset.
EPSCoR Eligibility
EPSCoR (Established Program to Stimulate Competitive Research) eligibility is assigned per state, per year, using NSF’s published eligible-jurisdiction lists rather than a static list – eligibility has changed over the 2010-2024 window as states entered or exited the program. Figure 7 compares federal share by tier and EPSCoR status.
The relationship between EPSCoR status and federal dependency is not consistent across tiers. In Tier1, Non-EPSCoR institutions maintain a higher federal share than EPSCoR institutions across the entire period (roughly 62% falling to 53%, versus 54% falling to 49% for EPSCoR) – the gap narrows over time but never closes. In Tier2, Non-EPSCoR starts higher (about 59% versus 56% in 2010) and stays above EPSCoR through roughly 2020, but the two cross around 2021 and EPSCoR ends higher by 2024 (about 53% versus 46%). Tier3 is the most volatile: both series cross repeatedly, but EPSCoR institutions end the period well above Non-EPSCoR, at roughly 63% versus 40-47% from 2021-2024. A single “EPSCoR institutions are less federally dependent” narrative, true for Tier1, does not hold once Tier2 and Tier3 are considered.
Figure 7. Federal Share of R&D by Tier and EPSCoR Status, 2010-2024.
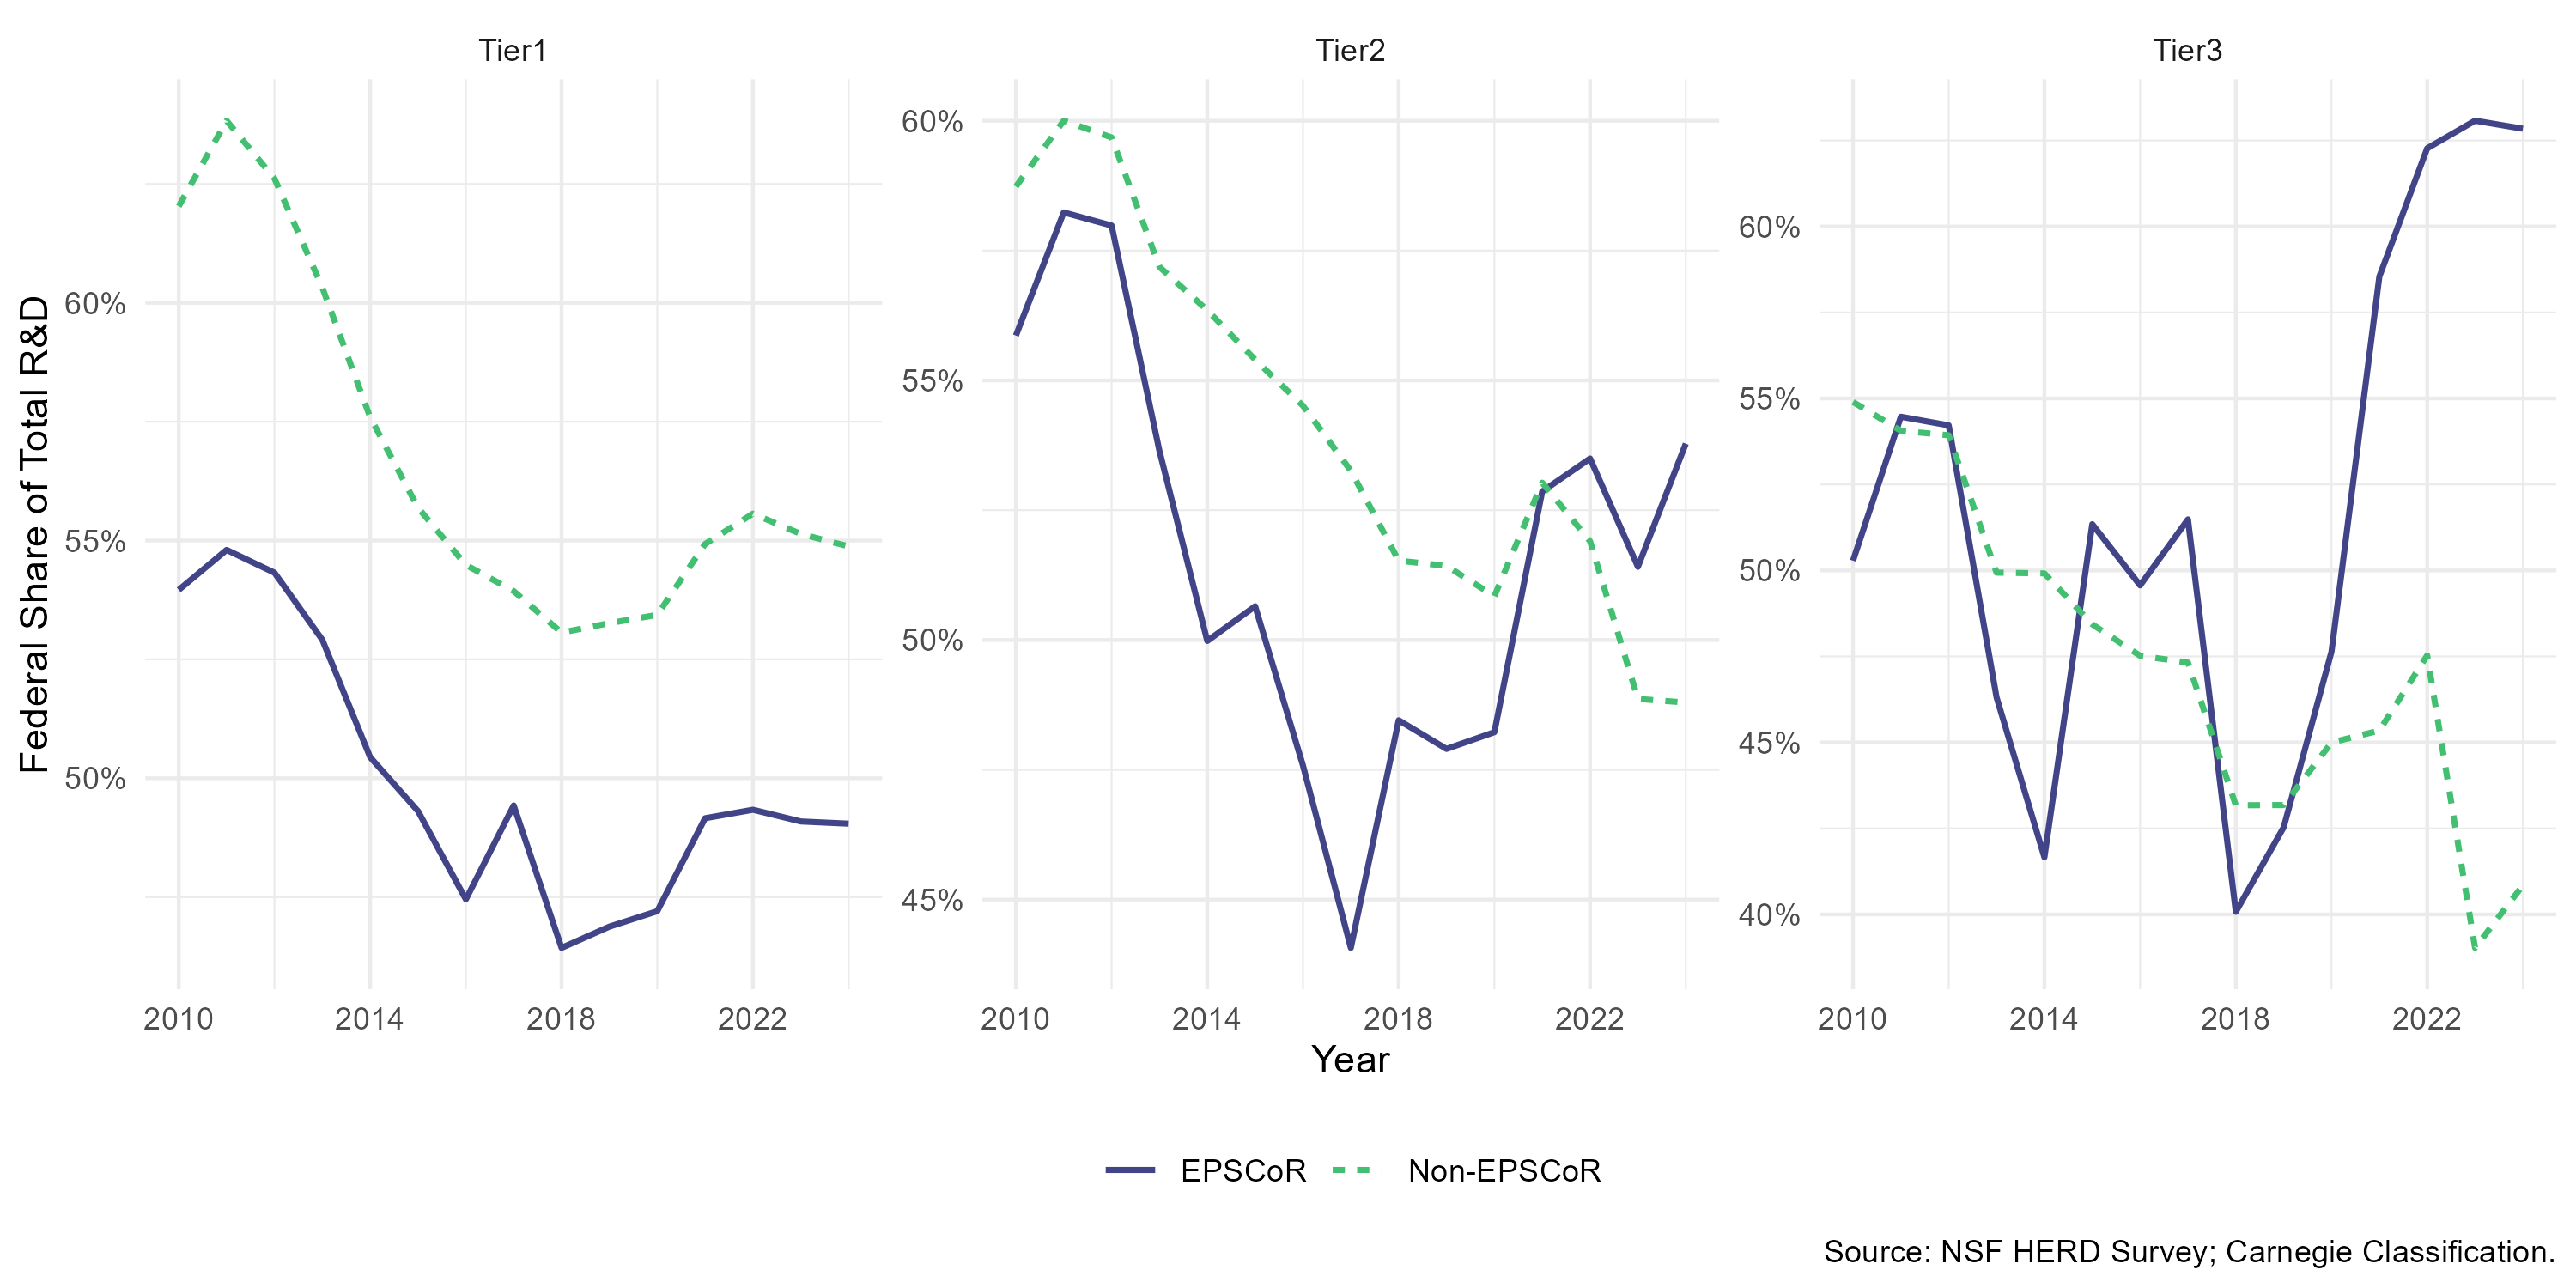
Interpretation: The Tier2 and Tier3 crossovers around 2020-2021 are the clearest visual evidence that EPSCoR’s relationship to federal dependency is not uniform across tiers.
To test whether this tier-level pattern holds at a finer grain, Table 1 and Figure 8 decompose 10-year (2010-2024) HERD growth by state and EPSCoR status. At the state level, *Table 1** shows that EPSCoR states show wider variance in 10-year HERD growth (SD 62.7% versus 45.1%) despite a slightly lower mean growth rate (76.3% versus 88.9%). This is consistent with a small number of EPSCoR states driving outsized growth alongside others that declined.
Table 1. Ten-Year (2010-2024) HERD Growth by EPSCoR Status, State Level.
| EPSCoR Status | States (n) | Mean Growth | SD | Min | Max | Range |
|---|---|---|---|---|---|---|
| EPSCoR | 26 | 76.3% | 62.7% | -72.3% | 203.8% | 275.6% |
| Non-EPSCoR | 24 | 88.9% | 45.1% | -60.1% | 158.7% | 218.4% |
EPSCoR states (*Figure 8**) are scattered across the full ranking rather than clustered at the bottom – several EPSCoR states (Delaware, Wyoming, Kansas) rank among the fastest-growing, while others (Nebraska, New Mexico, South Dakota) rank among the slowest. This state-level variation motivated a finer-grained look at institution-level growth.
Figure 8. Ten-Year Change in Total HERD by State, 2010-2024.
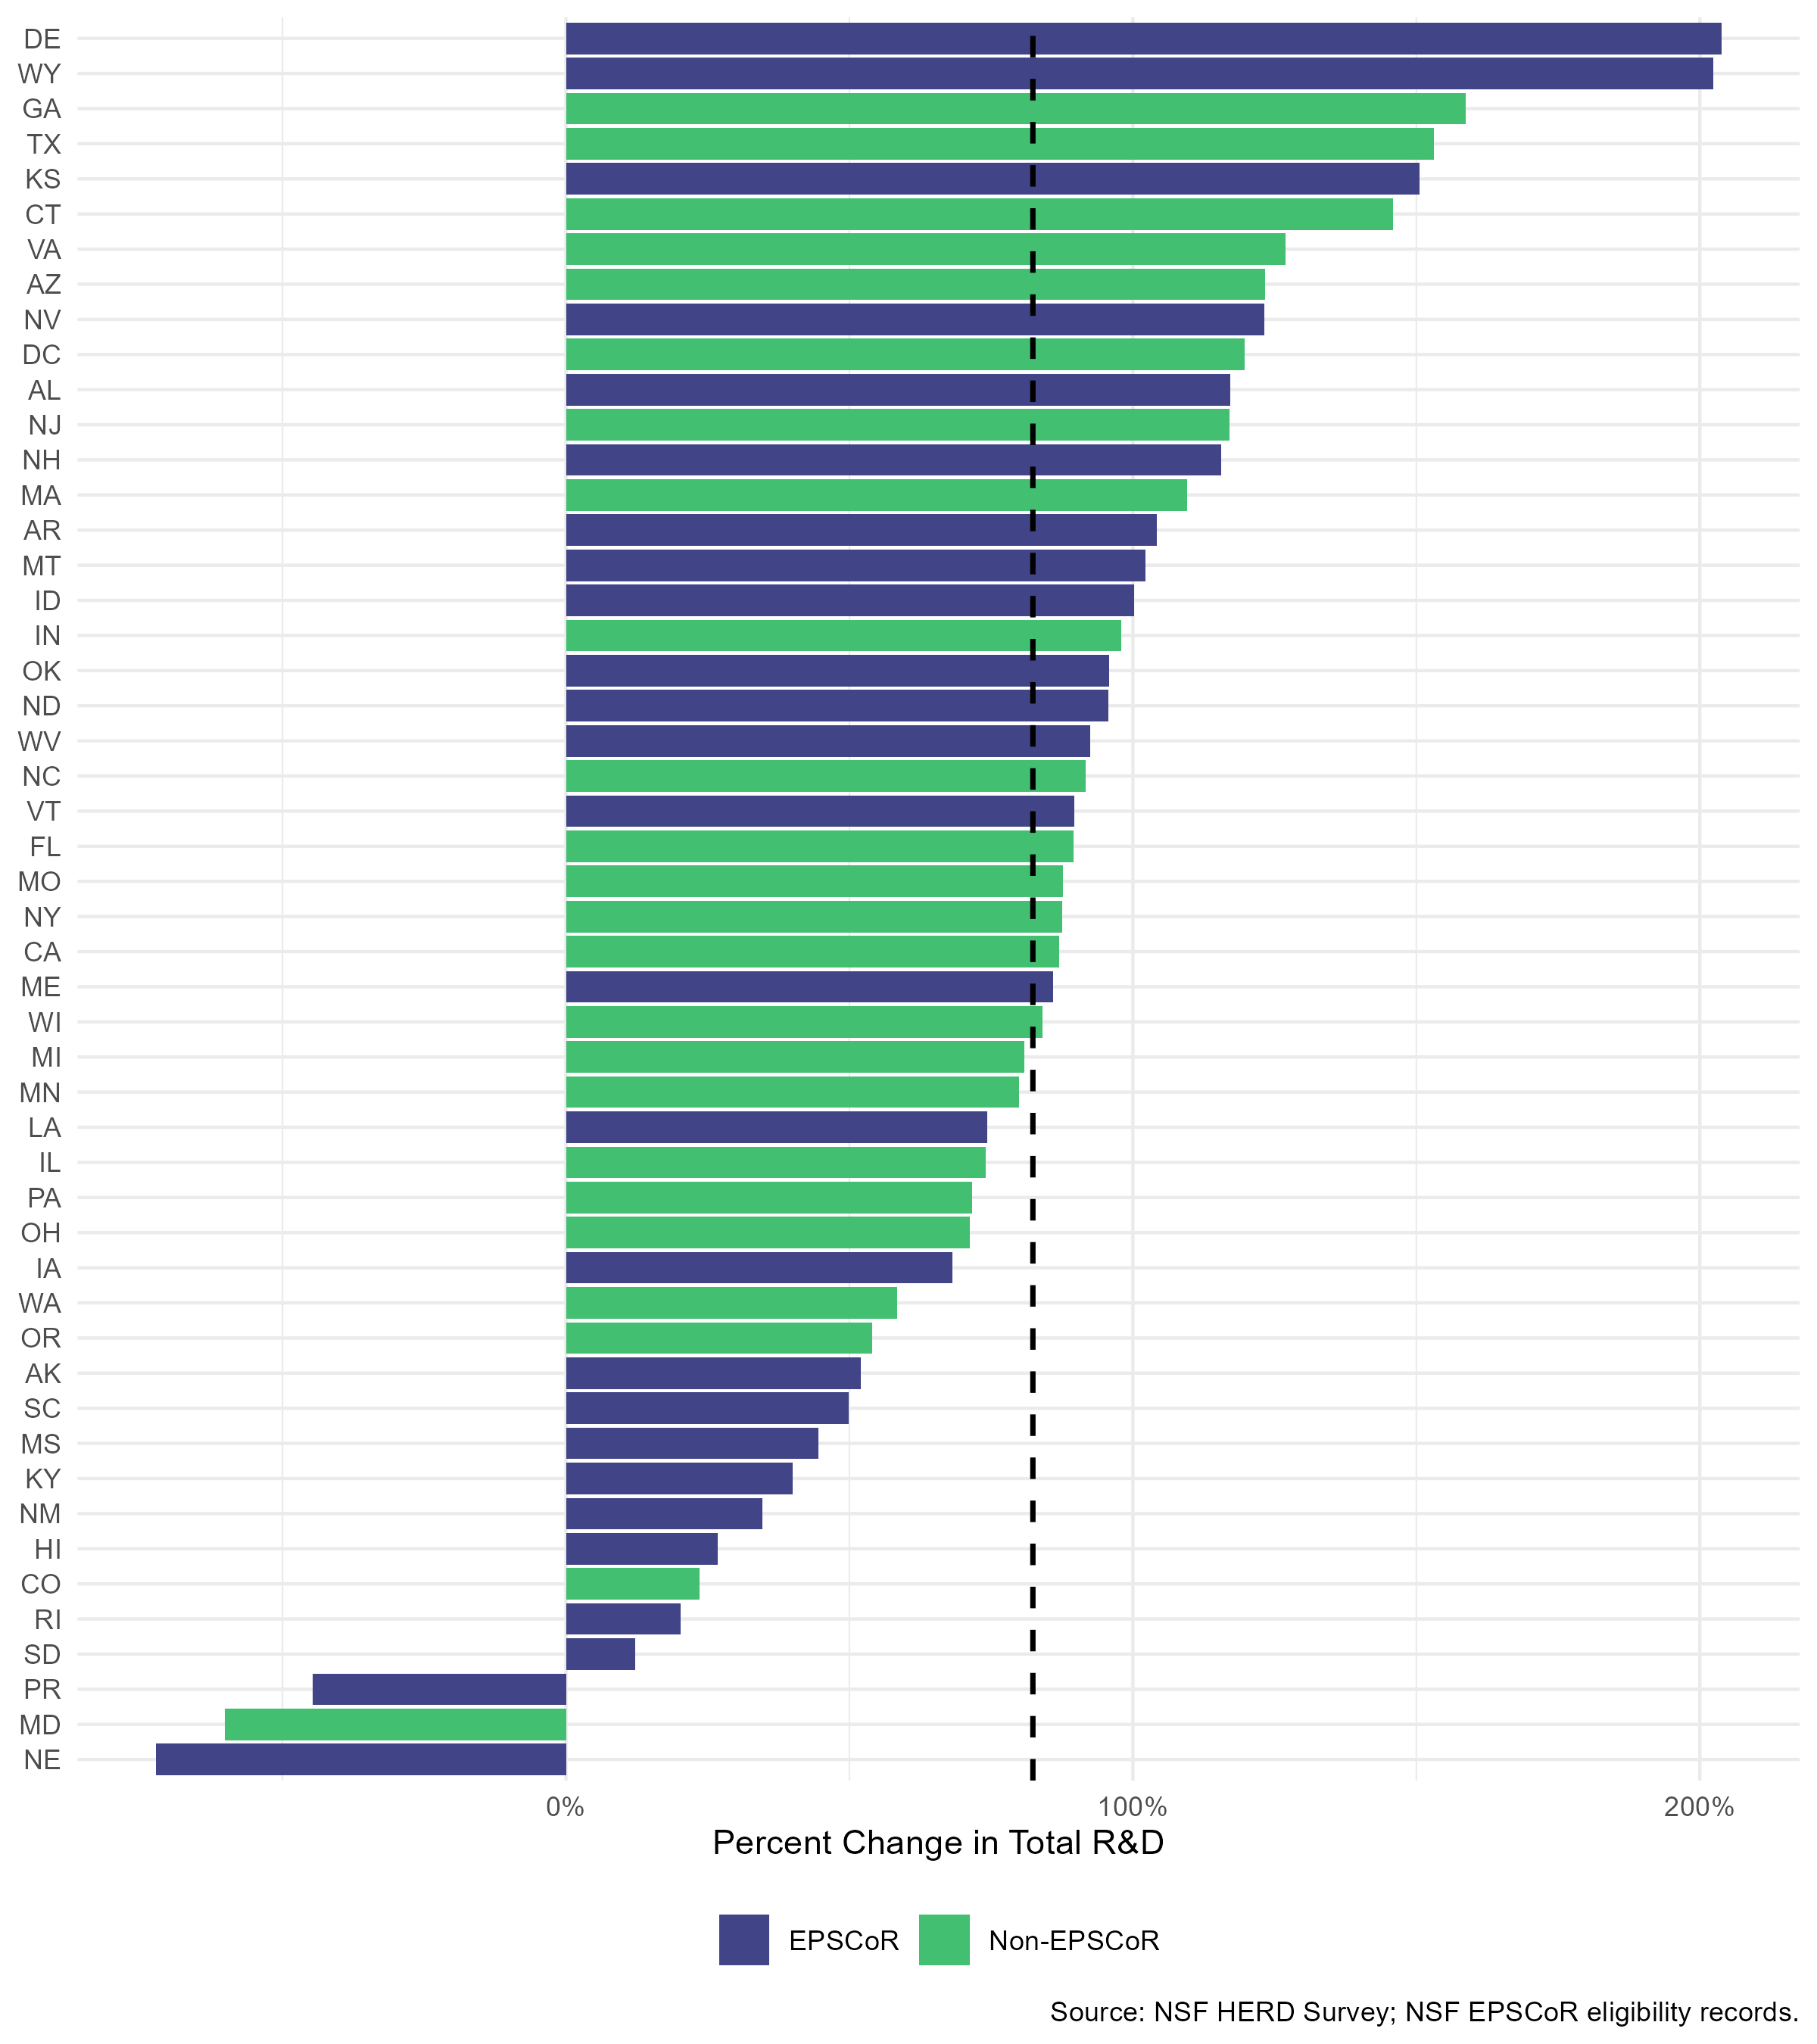
Interpretation: EPSCoR states scattered across the full ranking, rather than clustered at either extreme, argue against a simple EPSCoR-versus-Non-EPSCoR growth story at the state level.
Table 2 and Figure 9 repeat the growth decomposition at the institution level. Institution-level variance dwarfs state-level variance for both groups (SD well over 100% at the institution level versus under 65% at the state level), confirming that state-level aggregation masks substantial within-state differences between institutions. Non-EPSCoR institutions show both a higher mean growth rate (134.8% versus 92.4%) and a wider range (1241.1 percentage points versus 736.4), driven by a small number of extreme high-growth institutions.
Table 2. Ten-Year (2010-2024) HERD Growth by EPSCoR Status, Institution Level.
| EPSCoR Status | Institutions (n) | Mean Growth | SD | Min | Max | Range |
|---|---|---|---|---|---|---|
| EPSCoR | 52 | 92.4% | 119.3% | -74.9% | 661.5% | 736.4% |
| Non-EPSCoR | 171 | 134.8% | 154.3% | -96.7% | 1144.4% | 1241.1% |
In *Figure 8**, both distributions are right-skewed with a similar modal growth rate, but Non-EPSCoR has a visibly fatter right tail of high-growth outlier institutions, which pulls its state-level averages up in Figure 8 without reflecting the typical Non-EPSCoR institution’s experience. EPSCoR institutions are more tightly clustered around their mean, with fewer extreme outliers.
Figure 9. Distribution of Institution-Level HERD Growth by EPSCoR Status, 2010-2024.
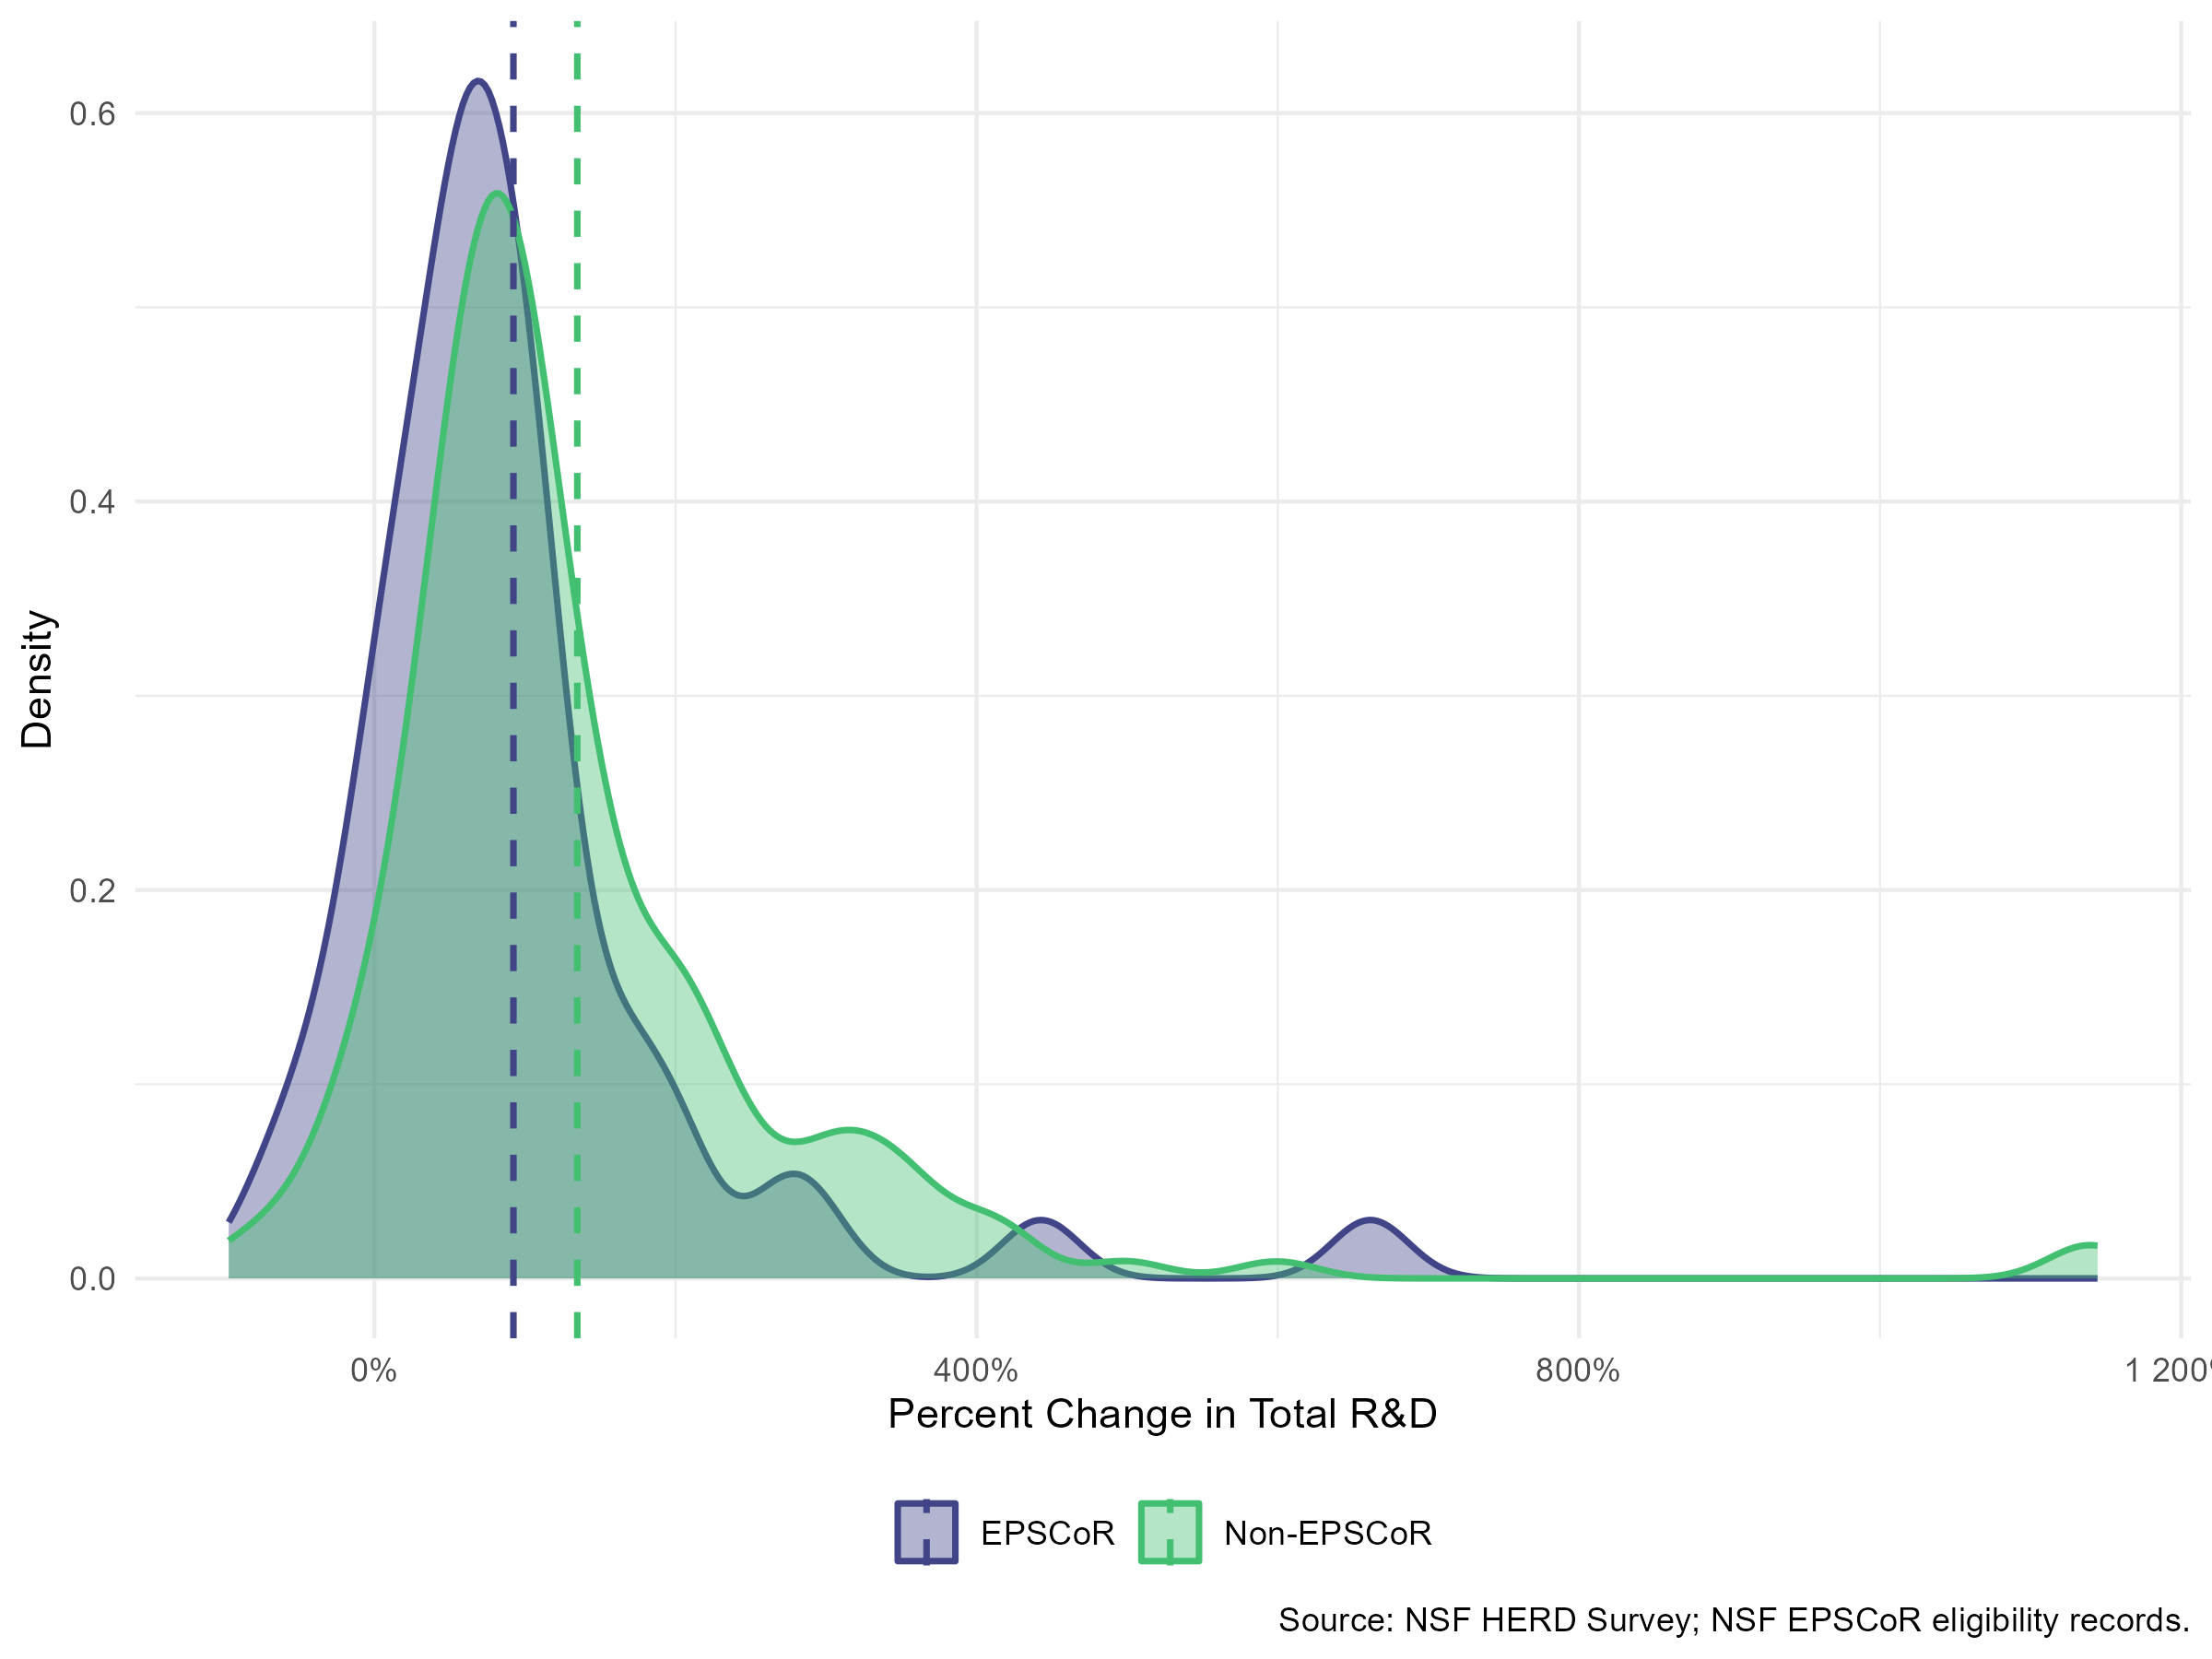
Interpretation: The fatter right tail for Non-EPSCoR institutions shows a handful of high-growth outliers, not the typical institution, drive that group’s higher mean.
Study Design
Data Source:
- NSF Higher Education Research and Development (HERD) Survey, the authoritative annual census of R&D expenditures at U.S. colleges and universities, including total and federally funded R&D expenditures by institution, source of funds, and field.
- Carnegie Classification Longitudinal Public Data File, filtered to the Doctoral category and years 2010 onward.
Data Handling:
HERD and Carnegie are matched via an exact join on institutional ID and Carnegie release cycle – HERD years are mapped to the nearest Carnegie cycle year, and records are joined on ipeds == unitid and herd_carnegieCycle == carnegie_year. Non-matching records are dropped by the join rather than reconciled by name or historical ID changes. This analysis therefore reports federal dependency only for institutions with a clean ID match in a given cycle, and does not attempt to track institutions whose Carnegie ID changed across cycles (see Next Steps). Institutions are classified into Tier1/Tier2/Tier3 from Carnegie’s NewVal field, labeled by current institutional control (public/private/for-profit), and assigned EPSCoR eligibility per state per year using NSF’s published eligible-jurisdiction lists, which vary over time rather than reflecting a single static list.
Analytical Approach:
- Join HERD and Carnegie data via exact match on institutional ID and release cycle; filter to doctoral institutions, 2010-2024.
- Classify institutions by Carnegie tier, institutional control, and time-varying EPSCoR eligibility.
- Calculate federal share of R&D expenditure by tier, field, and control, and each tier’s share of the total doctoral federal R&D pool.
- Decompose 2010-2024 total HERD growth by EPSCoR status at the state level and the institution level to test whether state-level patterns hold at finer grain.
Project Resources
Repository: herd-doctoral
Data:
- NSF HERD Survey data, available for download from the NCSES data portal
- Carnegie Classification Longitudinal Public Data File [PLACEHOLDER – need data description/source line, not found in prior project pages]
herd-post2010.csv– generated from the two source files above
Code:
prep-final_data.R– joins and filters raw Carnegie and HERD data to produceherd-post2010.csvanalysis.R– builds tier, field, control, and EPSCoR comparisons and produces all figures and tables
Project Artifacts:
- Figures (n=9)
- Tables (n=3)
Environment:
renv.lockandrenv/– restore withrenv::restore()
License:
- Code and scripts © Kara C. Hoover, licensed under the MIT License.
- Data, figures, and written content © Kara C. Hoover, licensed under CC BY-NC-SA 4.0.
Tools & Technologies
Languages: R
Tools: Quarto | GitHub Pages
Packages: dplyr | tidyr | ggplot2 | scales | viridis | stringr | janitor | readxl
Expertise
Domain Expertise: Higher education policy | Federal research funding | Institutional classification systems | Data wrangling at scale
Transferable Expertise: Translating fragmented, self-reported administrative data across institutional tiers into comparative funding-dependency analysis that surfaces where policy exposure concentrates and where classification-driven data gaps limit further inference.
Appendix
Table 3. Mean Federal Share of R&D by Field and Tier, 2010-2024 Average.
| Field | Tier1 | Tier2 | Tier3 |
|---|---|---|---|
| Computer and information sciences | 69.4% | 63.0% | 63.9% |
| Engineering | 58.8% | 58.4% | 52.8% |
| Geosciences, atmospheric sciences, and ocean sciences | 64.8% | 64.3% | 56.5% |
| Life sciences | 56.3% | 54.1% | 50.3% |
| Mathematics and statistics | 62.0% | 52.1% | 60.4% |
| Non-S&E | 26.4% | 28.8% | 33.0% |
| Other sciences | 35.2% | 40.5% | 20.1% |
| Physical sciences | 68.3% | 64.4% | 60.4% |
| Psychology | 64.6% | 56.8% | 43.2% |
| Social sciences | 37.6% | 33.6% | 30.6% |