Federal Funding of R1 University Research Has Declined for Fifty Years – and Current Cuts Risk Accelerating the Trend
Executive Summary
Problem: Federal funding is the backbone of research at U.S. R1 universities, but the structural dependency of these institutions on federal dollars has never been systematically examined across the full arc of the modern research enterprise. As the Trump administration implements sweeping cuts to NIH, NSF, and other research agencies in 2025, understanding the depth and geography of that dependency is urgent for institutions, policymakers, and the public.
Approach: This analysis draws on five decades of data from the NSF Higher Education Research and Development (HERD) Survey — the authoritative source on U.S. university R&D expenditures — spanning 1974 to 2024. R1 institutions were identified using Carnegie Classification criteria appropriate to each era. Federal dependency was measured as the share of total R&D expenditure funded by federal sources, examined at both the national and state levels. A linear model characterizes the long-run trend; an ARIMA(1,1,1) model projects federal dependency forward through 2034 to contextualize the current funding crisis.
Insights: Federal funding as a share of R1 R&D expenditure has declined steadily from roughly 75% in the mid-1970s to approximately 55% in 2024 — a structural shift driven by growth in institutional, industry, and philanthropic funding rather than by absolute declines in federal investment. The decline is consistent across Carnegie classification eras, meaning it reflects long-term structural change rather than any single policy moment. An ARIMA forecast projects continued stabilization near 55%, but the 95% confidence interval extends as low as 47% — a scenario consistent with sustained federal cuts of the magnitude currently underway.
Significance: The map tells a story that a single number cannot: federal dependency is not uniform across states, and the institutions most exposed to federal cuts are concentrated in states whose congressional delegations have the most to lose. This analysis provides both the longitudinal context and the geographic specificity that policymakers and institutional leaders need to understand what is at stake.
Key Findings
- Federal funding accounted for approximately 75% of R1 R&D expenditures in the mid-1970s, declining to 55% by 2024 — a structural shift that unfolded across five decades regardless of Carnegie classification era. These figures are in nominal terms; adjusting for inflation would show an even steeper decline in federal purchasing power for R1 research.
- A linear model confirms a statistically significant decline of approximately 0.004 percentage points per year (p < 0.001, R² = 0.81), meaning year alone explains 81% of the variance in federal dependency — Carnegie classification cycles add no explanatory power beyond year.
- An ARIMA(1,1,1) forecast projects federal dependency stabilizing near 55% through 2034 under historical trends, but the lower bound of the 95% confidence interval reaches 47% — consistent with scenarios involving sustained federal funding cuts.
- State-level dependency varies substantially; states with a single dominant R1 institution are most exposed to federal funding volatility.
- The animated choropleth map reveals geographic concentration of high-dependency states, enabling institution- and district-level interpretation.
Research Question
How has federal funding as a share of total R&D expenditure at R1 universities changed over time, and which states face the greatest exposure to federal funding cuts?
Research Answers
National Trend in Federal Dependency
Federal funding has declined as a share of total R1 R&D expenditure since the 1970s, falling from roughly 75% to 55% over five decades. A linear model confirms the decline is statistically significant — approximately 0.004 percentage points per year (p < 0.001, R² = 0.81) — meaning year alone explains 81% of the variance in federal dependency. The decline is not explained by Carnegie classification cycles — the long-run downward trend is consistent across every era of the classification system, reflecting a structural shift in how R1 institutions fund research rather than responses to any particular policy change.
Figure 1 shows a clear long-run decline punctuated by short-term fluctuations — most notably a temporary recovery around 2004–2006 and a sharp drop following 2010 as ARRA stimulus funds expired. Unlike dollar-based analyses where past values appear artificially low without inflation adjustment, proportions are directly comparable across time and striking. Federal funding has fallen as a share of total R1 R&D — from 75% in 1974 to 55% in 2024 — even as both federal and total expenditures grew in absolute terms. The forecast projects stabilization near 55% under historical trends, but the wide confidence interval reflects genuine uncertainty: the lower bound of the 95% interval reaches approximately 47%, which is consistent with scenarios involving sustained federal cuts of the magnitude currently being implemented. The flat central forecast is not reassurance — it is a baseline that assumes no structural break and also does not include the 2025 data, yet to be released. The 2025 will likely have a negative impact on outlooks due to the sharp decline in federal investment in science and technology that has yet to be offset by industry.
The series is punctuated by two notable peaks — one in the mid-1990s tied to post-Cold War growth in civilian R&D investment, and one around 2004 driven by the NIH budget doubling campaign of 1998–2003 flowing through to university expenditures. A brief recovery around 2010–2011 reflects Obama-era ARRA stimulus before funds expired, producing the sharpest single decline in the series. Recovery from the 2008 financial crisis has been incomplete.
Figure 1. Federal share of R&D expenditure at R1 universities, 1974–2024, with ARIMA(1,1,1) forecast through 2034. Shaded regions show 80% and 95% confidence intervals.
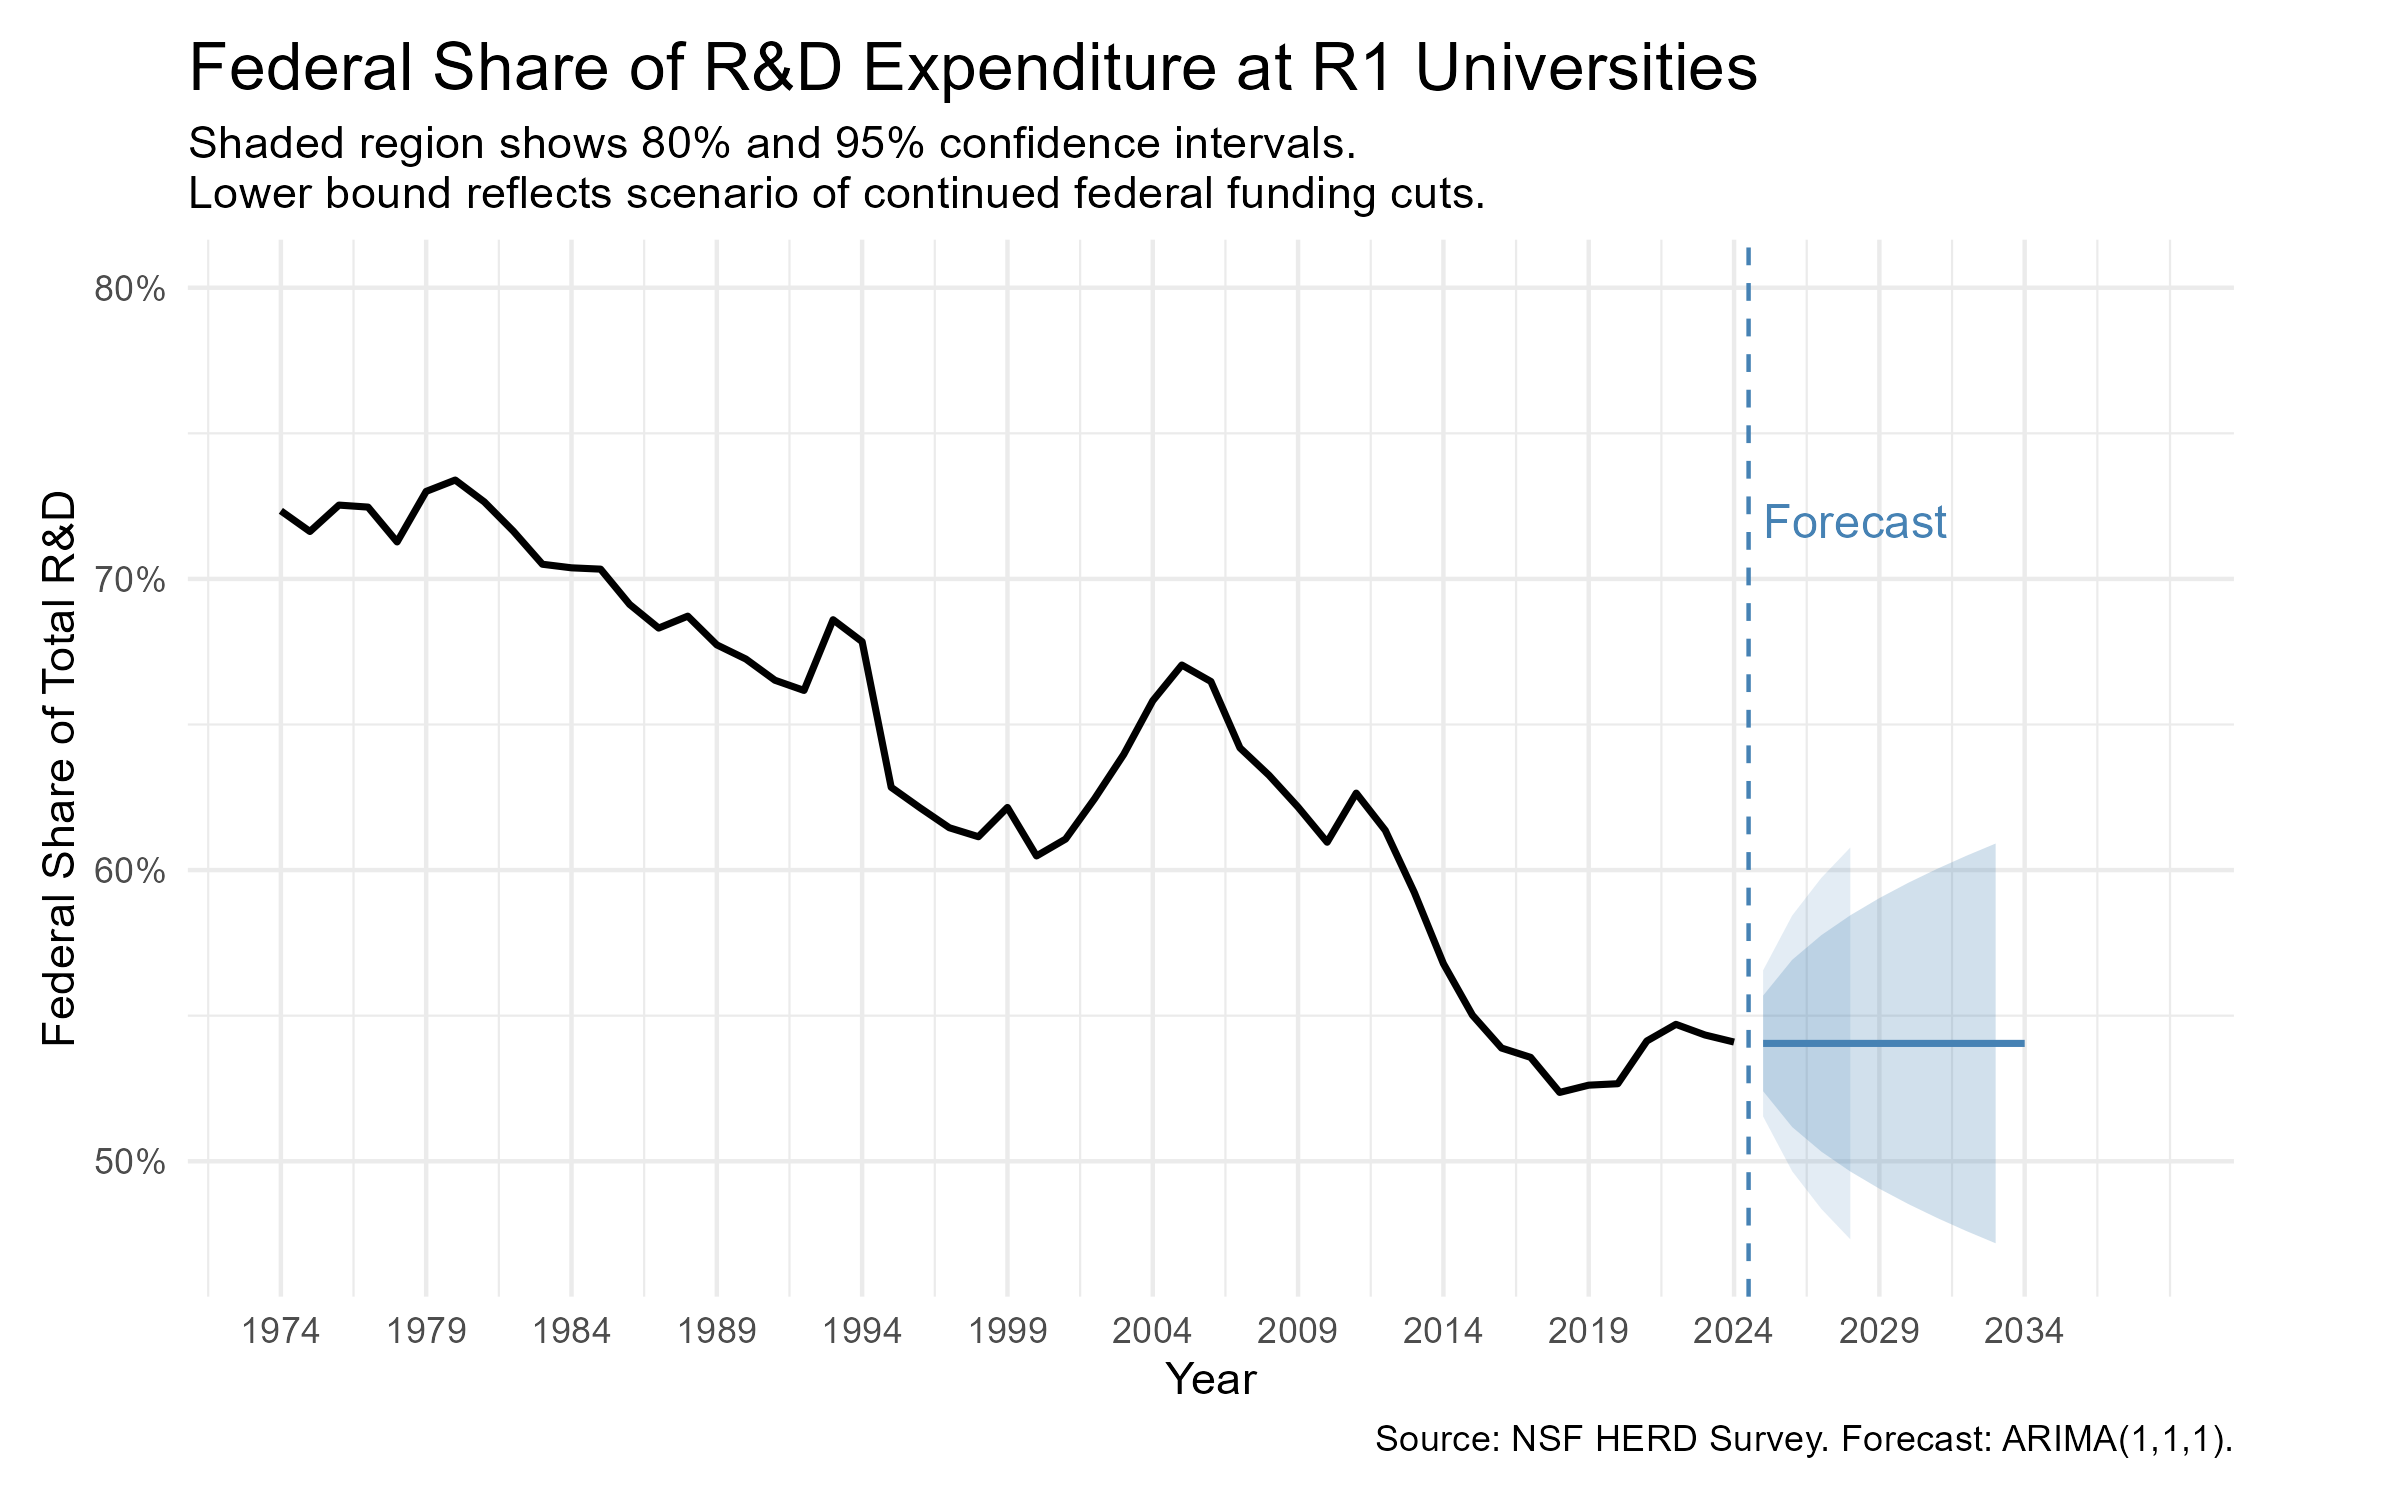
Interpretation: The long-run decline is visible across the full series, with the peaks and recovery tied to science and technology policy during those years. The forecast projects stabilization near 55% under historical trends, but the wide confidence interval reflects genuine uncertainty — the lower bound reaches approximately 47%, consistent with scenarios of sustained federal austerity. The flat central forecast is not reassurance; it assumes no structural break. CAVEAT: The data are not yet available for 2025, a year with extreme cuts to federal science investment that will very likely change projections negatively.
Geographic Distribution of Federal Dependency
The animated map shows each state’s federal share of R1 R&D expenditure relative to the national average in each year, classified into five natural groups using Jenks breaks on standardized scores.The visualization choice makes changes visible in a format designed for a policy audience: every member of Congress can find their state and immediately see whether their district’s R1 institutions are above or below the national average, and how that has changed over time. The accompanying benchmarking tables identify which states face the highest dependency and greatest volatility — directly actionable for advocacy.
Federal dependency is not uniform across states — and the geographic pattern has shifted substantially over fifty years. The expansion of R1 institutions across Carnegie cycles is visible in the map as states appear for the first time in 2000 and 2005. Several striking patterns emerge. Maryland has the highest and most sustained dependency throughout the series, reflecting a research portfolio dominated by federal health and defense investment, though it has declined from over 90% in the 1970s to 63% by 2021. California shows the most dramatic long-run decline — from 89% in 1973 to 56% by 2015 — as the UC system diversified its funding base. Ohio jumps sharply from around 60% to over 80% in 2010 and holds there, likely reflecting growth in federally funded research at Ohio State. Alabama nearly doubles its dependency between 2000 and 2005. Rhode Island is the most volatile state in the series, swinging from 63% to 37% in a single cycle before rebounding to 69%. Tennessee shows the reverse — high early dependency above 85% declining sharply to 42% by 2021.
Figure 2. Animated choropleth map of federal R&D dependency at R1 universities by state, 1974–2024. Darker colors indicate higher federal dependency relative to the national average. Grey indicates no R1 institution in the HERD data for that year.
Interpretation: High-dependency states tend to concentrate federal portfolios in defense, health, and basic science — the fields most exposed to current cuts. Low-dependency states have diversified revenue bases that provide some buffer. The temporal animation reveals a gradual geographic redistribution of dependency over fifty years, with the most striking shifts tied to specific funding events visible in the time series.
Benchmarking Federal Dependency Across States and Carnegie Cycles
Federal dependency patterns vary substantially across states and over time. Table 1 establishes benchmark thresholds using Jenks natural breaks — the five dependency classes define what high, average, and low dependency look like across the full fifty-year series. Table 2 identifies the highest and lowest dependency states by the most recent Carnegie cycle, showing how their positions have shifted across eras. Tables 3 through 6 characterize volatility — which states experience the most year-to-year variation in federal dependency and which show the largest swings — identifying where the current cuts will land hardest.
The benchmark thresholds in Table 1 show that high-dependency states average 79% federal share — more than double the low-dependency average of 37%. The gap between classes is substantial and consistent, confirming that federal dependency is not a continuum but a meaningful structural divide among R1 states.
Table 1. Federal dependency benchmark metrics by Jenks classification. Values represent state-year combinations across the full time series.
| Dependency Class | N (State-Years) | Mean | Min | Max |
|---|---|---|---|---|
| Low | 116 | 37% | 21% | 53% |
| Below Average | 414 | 48% | 34% | 65% |
| Average | 432 | 59% | 46% | 76% |
| Above Average | 386 | 69% | 56% | 88% |
| High | 254 | 79% | 63% | 95% |
In Table 2, Colorado and Ohio have maintained high dependency across nearly every Carnegie cycle, while Rhode Island is notable for its volatility — dropping sharply in 2010 before rebounding. The low-dependency states — Arkansas, North Dakota, and Nebraska — are newer entrants to the R1 category with smaller and more diversified research portfolios.
Table 2. Highest and lowest federal dependency states by 2021 Carnegie cycle. Values are mean federal share of total R1 R&D expenditure per cycle. – indicates no R1 institution in HERD data for that cycle.
| State | 1973 | 1976 | 1987 | 1994 | 2000 | 2005 | 2010 | 2015 | 2018 | 2021 | Category |
|---|---|---|---|---|---|---|---|---|---|---|---|
| CO | 79% | 74% | 74% | 68% | 78% | 79% | 77% | 76% | 71% | 75% | High |
| OH | 65% | 62% | 56% | 57% | 58% | 60% | 81% | 79% | 81% | 78% | High |
| RI | – | – | – | 62% | 63% | 62% | 37% | 49% | 69% | 69% | High |
| AR | – | – | – | – | – | – | 27% | 28% | 29% | 36% | Low |
| ND | – | – | – | – | – | – | 33% | – | – | 27% | Low |
| NE | – | – | – | – | – | 36% | 41% | 33% | 34% | 33% | Low |
Table 3 and Table 4 show the most and least sensitive states by standard deviation — a measure of year-to-year variability in federal dependency. Iowa, Tennessee, North Carolina, Washington, and California show the highest variability, meaning their federal share fluctuates most dramatically across the series. Vermont, New Mexico, Maine, Nevada, and Minnesota are the most stable, with federal dependency changing little from year to year.
Table 3. Most sensitive states (highest SD), 1974–2024.
| State | Mean | SD |
|---|---|---|
| IA | 57% | 16% |
| TN | 69% | 15% |
| NC | 65% | 14% |
| WA | 71% | 14% |
| CA | 75% | 13% |
Table 4. Least sensitive states (lowest SD), 1974–2024.
| State | Mean | SD |
|---|---|---|
| VT | 66% | 2% |
| NM | 69% | 3% |
| ME | 48% | 3% |
| NV | 40% | 3% |
| MN | 55% | 3% |
Table 5 and Table 6 capture the full range of swings — the difference between a state’s highest and lowest federal dependency across the series. Iowa reaches as high as 90% and as low as 33%, a 57-point swing. North Carolina touches 95% at its peak. Vermont and Maine show the narrowest bands, suggesting insulation from federal funding cycles. The overlap between the most sensitive and biggest-swing states confirms structural exposure rather than random fluctuation.
Table 5. Biggest swings in federal dependency (highest range), 1974–2024.
| State | Min | Max | Range |
|---|---|---|---|
| IA | 33% | 90% | 57% |
| NC | 43% | 95% | 52% |
| TN | 41% | 89% | 48% |
| WA | 40% | 87% | 46% |
| CA | 51% | 91% | 40% |
Table 6. Smallest swings in federal dependency (lowest range), 1974–2024.
| State | Min | Max | Range |
|---|---|---|---|
| VT | 63% | 69% | 6% |
| WY | 38% | 48% | 10% |
| ME | 44% | 51% | 7% |
| NV | 35% | 43% | 8% |
| MN | 49% | 60% | 11% |
Next Steps
In addition to updating the analysis with HERD 2025 when available, the analysis could be extended to using the HERD data to characterize the field-level and agency-level dimensions of federal dependency:
- Federal expenditures by field and agency — examining which research fields (life sciences, engineering, physical sciences, social sciences, and non-S&E fields) are most exposed to agency-specific cuts, particularly NIH, NSF, DOD, and DOE.
- Capital expenditures by field — examining infrastructure investment patterns as a downstream indicator of federal dependency.
- Type of R&D conducted — distinguishing basic research, applied research, and experimental development to identify where cuts fall hardest on the research pipeline.
Study Design
Data Source: NSF Higher Education Research and Development (HERD) Survey, the authoritative annual census of R&D expenditures at U.S. colleges and universities. Data span fiscal years 1974–2024 and include total and federally funded R&D expenditures by institution, source of funds, and field.
Data Handling: R1 institutions were identified using Carnegie Classification criteria appropriate to each historical era: top 50 institutions by federal grants received for 1974–1994 (the criterion used in the inaugural classification); Carnegie R1/Very High Research Activity designation for post-2010 data, matched to HERD via IPEDS unit ID. Pre-2010 institution names were matched to Carnegie using a combination of string normalization and fuzzy matching (Jaro-Winkler distance), with manual review of ambiguous cases. Federal dependency was calculated as the ratio of federally funded R&D expenditure to total R&D expenditure, aggregated to the state level by year.
Analytical Approach:
- Cleaned and standardized institution names across five decades of HERD data to enable consistent identification of R1 institutions.
- Filtered to R1 institutions using era-appropriate Carnegie criteria; matched pre-2010 data via fuzzy name matching and post-2010 data via IPEDS unit ID join.
- Calculated federal share of total R&D expenditure at the national level annually and at the state level annually.
- Applied z-score normalization within each year and Jenks natural breaks classification across all years to produce consistent dependency categories for the animated map.
- Fitted a linear model (federal share ~ year) to characterize the long-run trend; tested Carnegie cycle as an additional predictor.
- Fitted an ARIMA(1,1,1) model to the national time series and projected forward 10 years with 80% and 95% confidence intervals.
Project Resources
Repository: r1-federal-funding-dependency
Data: NSF HERD Survey data, available for download from the NCSES data portal. Raw data files are not included in the repository due to size; Carnegie classification data are included.
Code:
r1-federal-funding-dependency.R– full analysis pipeline: data wrangling, Carnegie matching, time series modeling, map and forecast figure generation
Project Artifacts:
federal-dependency-forecast.png– ARIMA forecast figurefederal-dependency-map.gif– animated choropleth mapfuzzy-match-inspect.csv– manual review file for pre-2010 institution name matching
Environment:
renv.lockandrenv/– restore withrenv::restore()
License:
- Code and scripts © Kara C. Hoover, licensed under the MIT License.
- Data, figures, and written content © Kara C. Hoover, licensed under CC BY-NC-SA 4.0.
Tools & Technologies
Languages: R
Tools: GitHub | Quarto
Packages: dplyr | stringr | stringdist | fuzzyjoin | ggplot2 | gganimate | forecast | classInt | urbnmapr | viridis | scales | tidyr | gifski
Expertise
Domain Expertise: higher education policy | federal research funding | time series analysis | geospatial visualization | data wrangling at scale
Transferable Expertise: This project demonstrates the ability to translate complex longitudinal institutional data into policy-relevant insights for non-technical audiences — combining rigorous statistical modeling with geographic storytelling to make a structural argument visible and actionable for decision-makers.